
Figure 9.
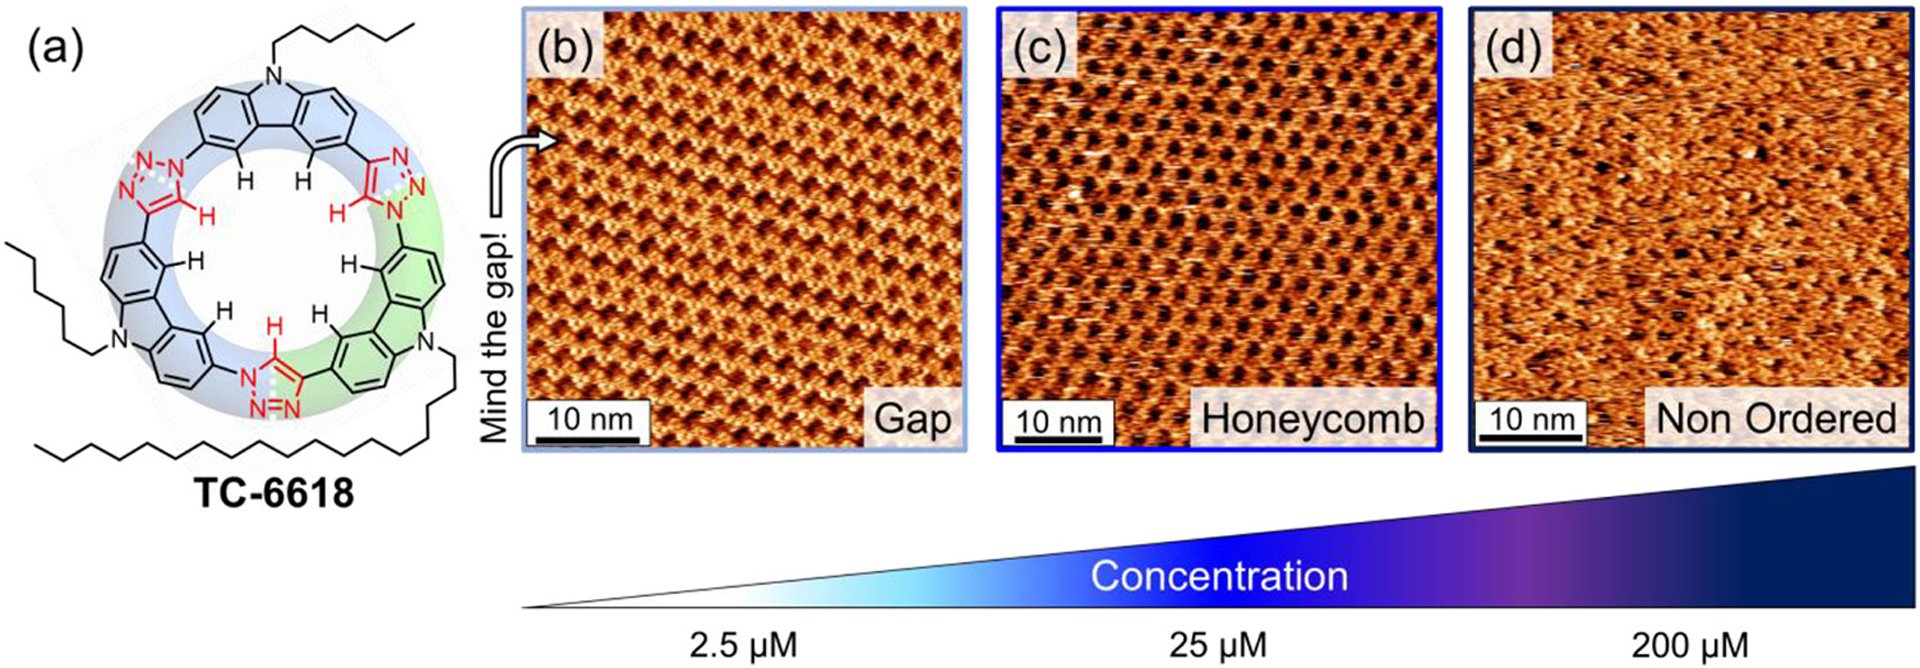
High-resolution STM images of (a) TC-6618 at the TCB/graphite interface showing (b) gap phase (25 μM, It = 0.15 nA, Vsample = −1 V), (c) honeycomb (unit cell: a = b = 2.9 ± 0.1 nm; 100 μM, It = 0.55 nA, Vsample = −1 V), and (d) nonordered packing states (300 μM, It = 0.5 nA, Vsample = −0.8 V).