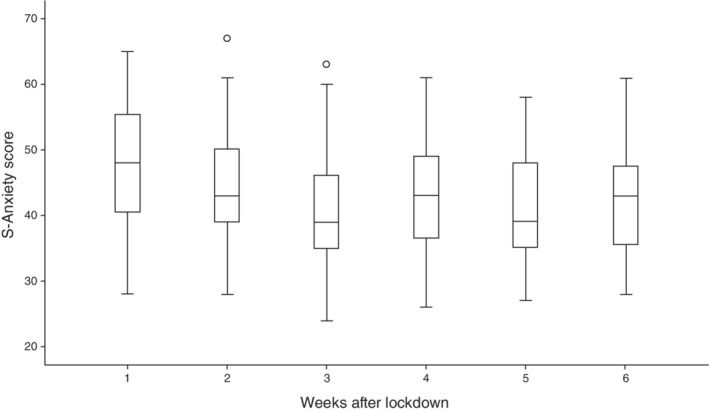
Fig. 1.

Boxplots of S‐Anxiety scores each week after lockdown. The top of the box represents the 75th centile, the bottom the 25th centile, and the horizontal line in the box represents the median. The T‐bars represent the maximum and minimum values, excluding outliers; the latter are shown as separate circles.
