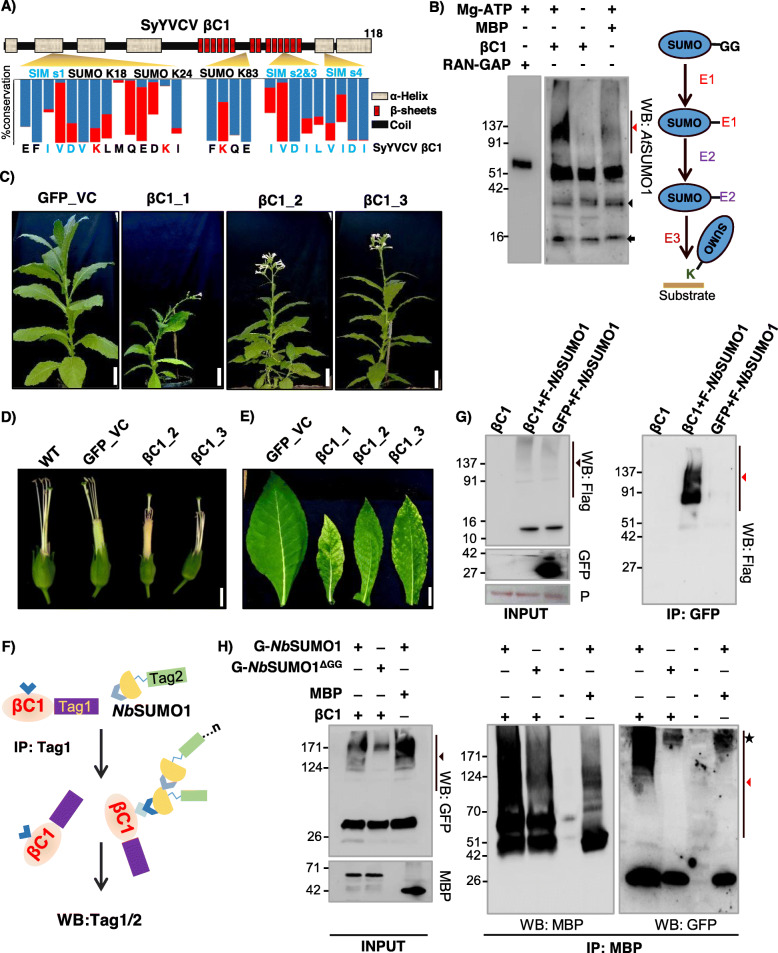
Fig. 1.
βC1 undergoes SUMOylation in vitro and in vivo. a Schematic showing predicted SUMOylation and SIM sites. Secondary structure was predicted using Predictprotein software. Blue bar indicates the percentage of amino acid conservation between βC1 sequences. The red bar shows the presence of structurally similar residue substitutions. b Left panel: in vitro SUMOylation with MBP-βC1 (59 kDa), MBP (42 kDa) and RanGap (63 kDa, positive control) using purified SUMO conjugating enzymes. Right panel: schematic of SUMOylation cascade. Red and black triangles represent poly-SUMOylated substrates and E1-SUMO conjugate, respectively. The black arrow indicates NbSUMO1. c Phenotype of transgenic N. tabacum lines overexpressing eGFP-tagged βC1. d Flower phenotype (without petals). e Symptomatic leaves of transgenic βC1 plants. f Diagram showing the Co-IP presented in g and h. g Co-IP of transiently expressed GFP-βC1 (42 kDa) and vector GFP with co-expressed Flag-tagged NbSUMO1 (F-NbSUMO1). h Co-IP of transiently expressed MBP-βC1 (59 kDa) with co-expressed GFP-tagged NbSUMO1 and NbSUMO1ΔGG. Size bars in c, d and e are 10, 0.8 and 3 cm, respectively. Black and red triangles indicate NbSUMO1 poly-SUMOylated proteins and NbSUMO1-βC1 conjugates, respectively. The asterisk indicates a non-specific band. P, Ponceau staining showing RUBISCO large subunit. Protein sizes are shown in kDa

