Fig. 7.
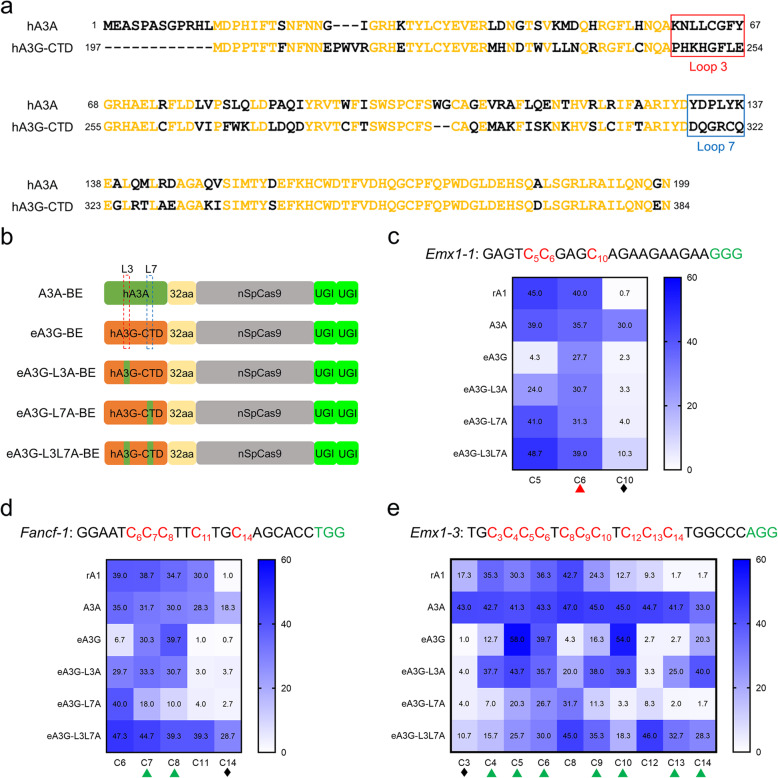
Comparison of base editing activity using loop3 and loop 7 grafted eA3G-BEs. a Amino acid alignments of hA3A and hA3G-CTD. The loop 3 and 7 regions are shown in red and blue rectangular box, respectively. b Schematic representation of five base editors’ architecture. The dotted rectangle box indicates loop 3 and loop7 region. c–e Heat maps showing C-to-T editing efficiencies for six base editors at Emx1-1 (c), Fancf (d), and Emx1-3 (e). The CC or CCC context was shown in red triangle or green triangle, respectively. The GC context was shown in black diamond. Values and error bars reflect the mean ± s.e.m. of three independent biological replicates

