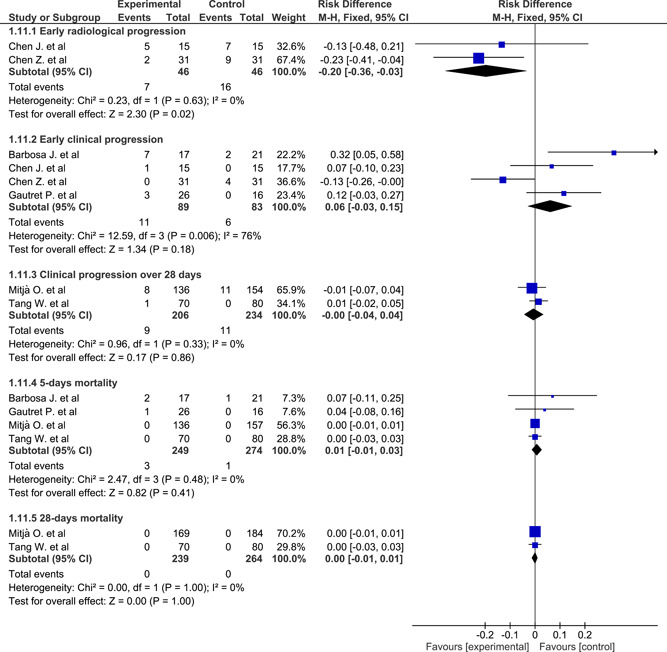
Figure 4.

Forest plot of radiological and clinical progression and mortality using the fixed‐effect model and risk difference with 95% confidence interval

Forest plot of radiological and clinical progression and mortality using the fixed‐effect model and risk difference with 95% confidence interval