
Figure 4.
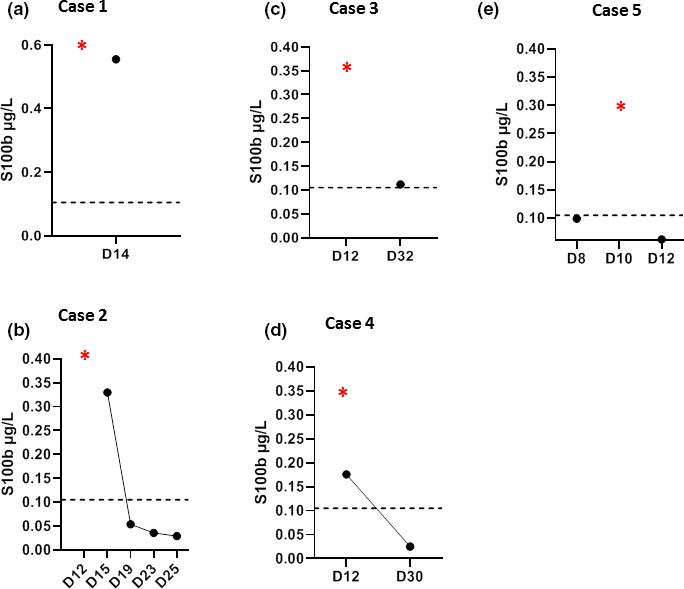
Temporal course of serum S100B (µg/l) levels in the five patients studied. Values above the dotted line indicate high values (>0.105 µg/l). Red stars denote the days on which levels of cytokine release syndrome‐related inflammatory biomarkers reached a peak. All longitudinal data are shown with respect to the date of COVID‐19 symptom onset (D0). [Colour figure can be viewed at wileyonlinelibrary.com]