
FIGURE 2.
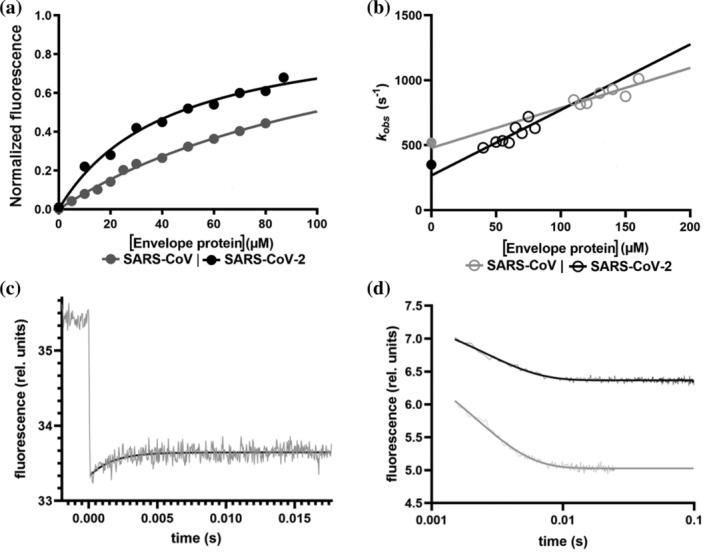
Comparing the binding of peptides mimicking the Envelope protein of SARS‐CoV and SARS‐CoV‐2 to the PDZ domain of PALS1. (a) Equilibrium binding titration monitored by FRET between PALS1 PDZ domain and dansylated peptides mimicking the Envelope protein of SARS‐CoV (in gray) and SARS‐CoV‐2 (in black). Lines are the best fit to a hyperbolic function. (b) Observed rate constants calculated from T‐jump kinetics at different concentrations of dansylated SARS‐CoV (gray empty circles) and SARS‐CoV‐2 (black empty circles) peptides. Lines represent the best fit to a linear function. Full gray and black circles represent the microscopic dissociation rate constant (k off) calculated from stopped‐flow displacement experiments (displacement traces fitted to a single exponential equation are reported in (d)—gray SARS‐CoV, black SARS‐CoV‐2). (c) Representative T‐jump experiment carried out in the presence of PALS1 PDZ and dansylated peptide mimicking the Envelope protein from SARS‐CoV‐2. The monitored reaction appears to be complete within ~4 ms. Fluorescence emission before and after the temperature jump is shown (in gray). Black line represents the best fit to a single exponential function