Figure 1.
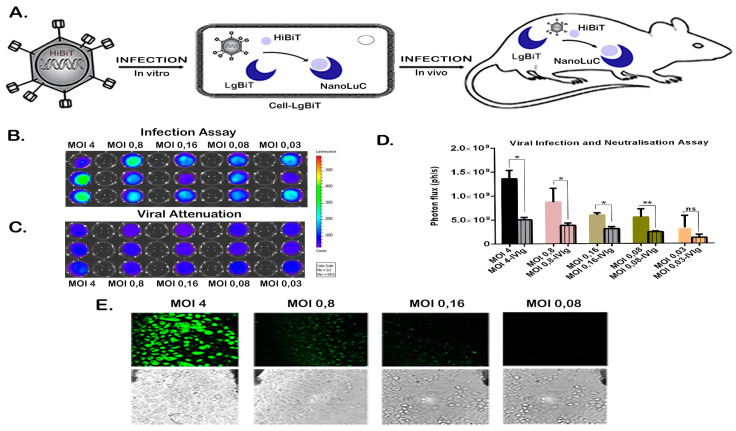
Detection of HiBiT-reporter in vitro. (A) Schematic representation of NanoBiT system applied for imaging of viral infection in vivo and in vitro. Bioluminescence in vitro imaging of HiBiT-reporter virus infection by applying the NanoBiT system (B,C). PC-3-LgBiT cells were infected with: (B) HiBiT-reporter virus or (C) with neutralized HiBiT-reporter virus by pre-incubation with intravenous immunoglobulin G (IvIg). The HiBiT-reporter virus infection was performed with several dilutions of viral stock (ranging from 4 to 0.03 MOI). The virus-exposed cells were imaged 24 h post infection by addition of substrate from the Nano-Glo Luciferase Assay System with a final concentration of 0.01 mm. (D) Signals were quantified with IVIS software. Quantification of detected signal as correlation between detected light and viral infectivity after background subtraction. Results are presented as means +SD. Data are significant different (one-way ANOVA F-value of 30.16) and the signal of infected cells is significantly different from the neutralization assay (* p-value < 0.01, ** p-value < 0.001) (E) Fluorescence microscopy of PC-3-LgBiT cells infected with different HiBiT-GFP-reporter virus dilutions (varying from 4 to 0.03 MOI). For checking the transfection rate using the GFP signal, fluorescence was detected 24 h post infection. Size of the scale bar is 2 µm.

