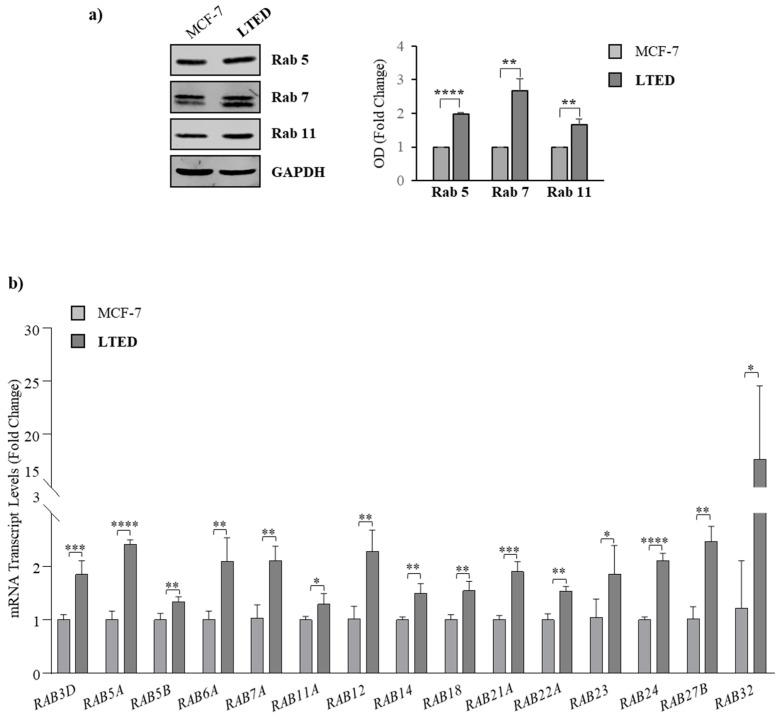
Figure 4.
Rab expression in MCF-7 and MCF-7 LTED cells. (a) Immunoblot analysis showing protein levels of Rab5, Rab7 and Rab11 in MCF-7 and MCF-7 LTED cell lysates. GAPDH was used as a control for equal loading and transfer. The histogram represents the average fold change ± S.D. of three separate experiments in which band intensities were evaluated in terms of optical density arbitrary units (OD), and expressed as fold change versus MCF-7 cells; (b) Real-time RT-PCR for mRNA levels of RAB genes in MCF-7 and MCF-7-LTED cells. Data are expressed as means ± S.D. of three different experiments, each performed in triplicate. *, p < 0.05; ** p < 0.005; ***, p < 0.0005; ****, p < 0.0001.

