
FIGURE 1.
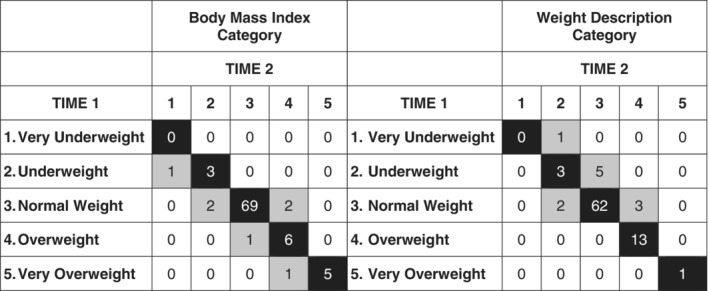
Longitudinal changes in BMI category (left) and weight description category (right) from Time 1 to Time 2. Values on the diagonal (in black) represent stability in BMI category (left) and description of weight category (right) from Time 1 to Time 2. Values above the diagonal represent an increase from a lower to a higher category from Time 1 to Time 2. Values below the diagonal represent a decrease from a higher to a lower category from Time 1 to Time 2