Figure 1.
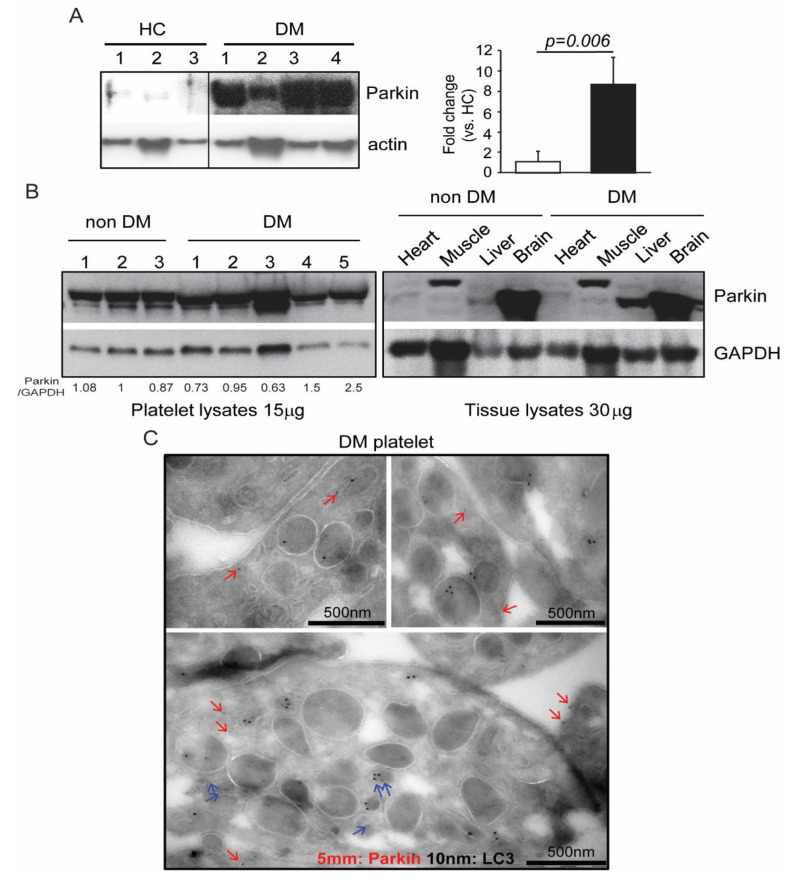
Parkin was highly expressed in platelets. (A) Western blot analysis of Parkin expression in human platelets (platelets isolated from three healthy control and four diabetic patients) (left). Quantification of Parkin in HC and DM (right) (B) Platelets, heart, muscle, liver, and brain tissues isolated from non-DM and DM mice (platelets isolated from three non-DM and five DM mice). Western blot analysis of Parkin in each sample with lanes representing individual mice. (C) Parkin and LC3 immuno-EM analysis of DM platelets where 5 nm dots indicate immunogold-labeled Parkin clusters, and 10 nm dots indicate immunogold-labeled LC3 clusters. Representative areas of clusters of gold labeling in DM patients (A–C) are presented. Blue arrows indicate mitochondrial and granular Parkin. Red arrows indicate parkin in other regions.

