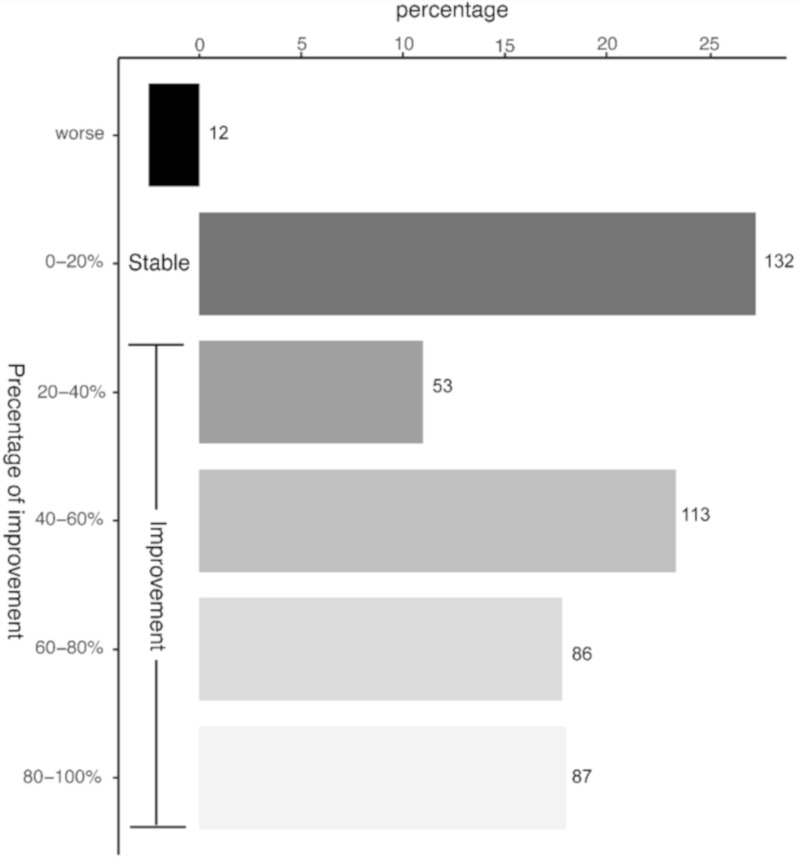
Figure 1.
Pain improvement following LDRT. Patients scored the subjective improvement of their pain level in percentage of improvement in regard of their initial pain level before therapy. The pain levels were determined after the last LDRT session, as well as 12 and 24 weeks after LDRT, if available. The figure depicts the best therapeutic response of the patients independent of the time point and the single and cumulative dose. Patients with an improvement up to 20% were considered as those with a stable disease. The numbers at the bars depict the number of patients of the analysis with the corresponding percentage of improvement.

