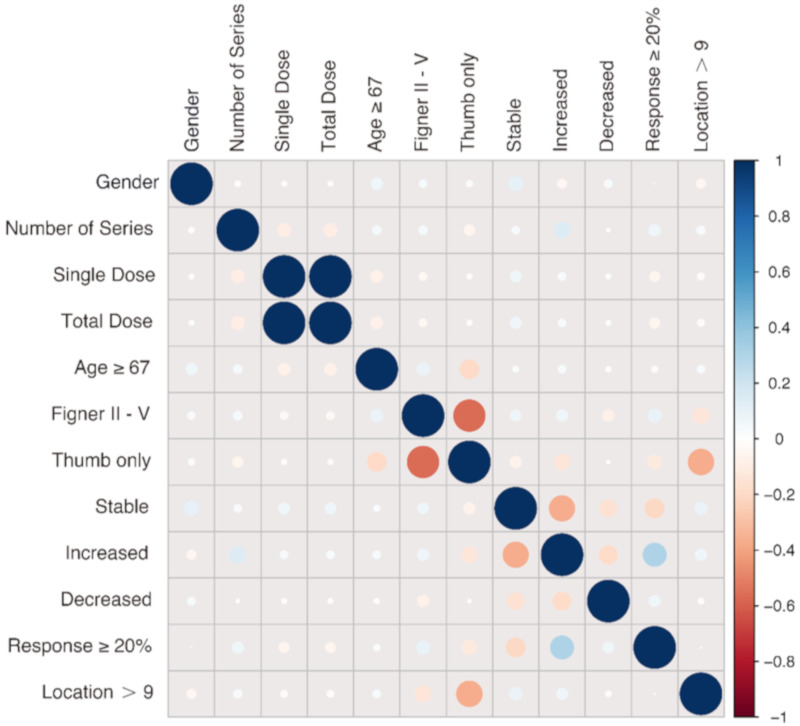
Figure 5.
Correlation plot summarizing the analyzed impact factors. The size of the dots states the strength of the correlation while the color reveals a positive (blue) or negative (red) correlation between two factors. The plot visualizes the correlation of all investigated impact factors on treatment success.

