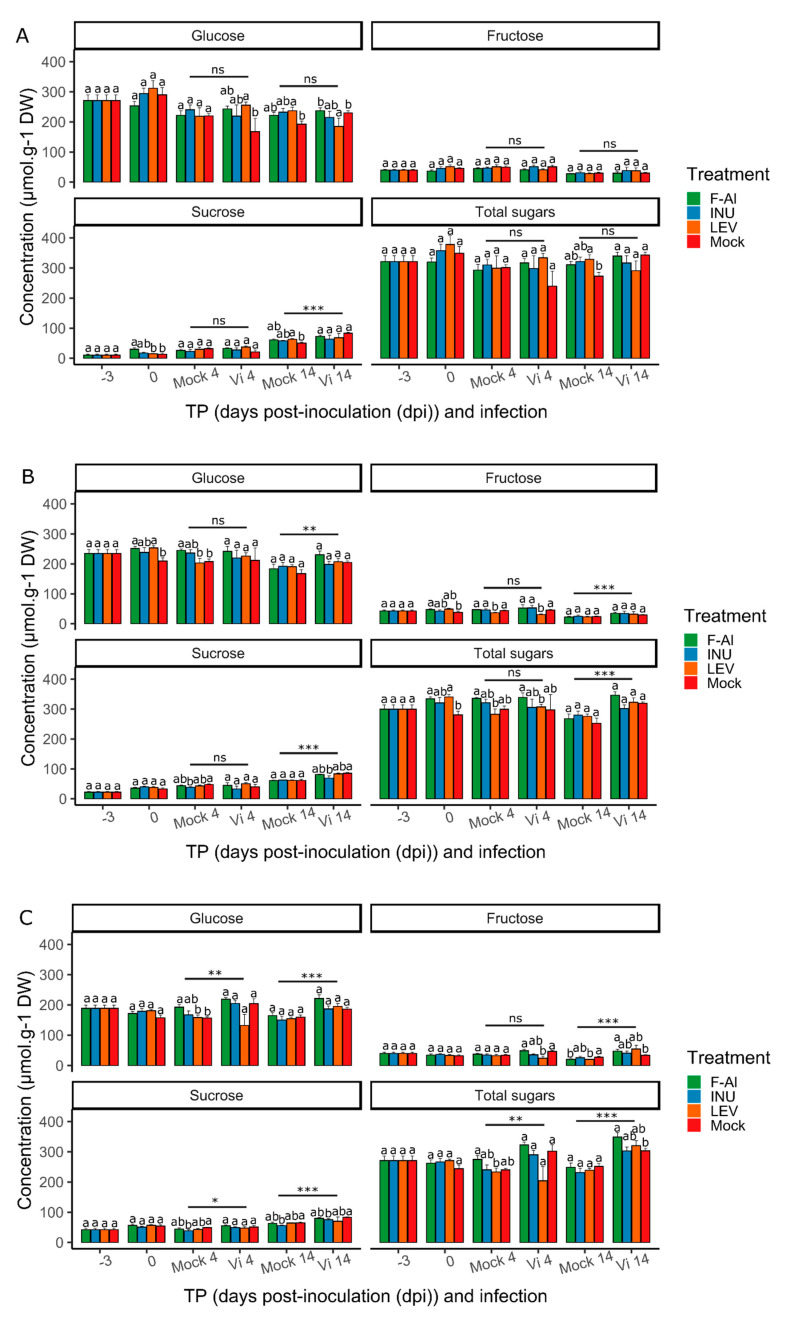
Figure 4.
Soluble sugar concentrations (in µmoles/g dry weight (DW)) in leaves infected with Venturia inaequalis as a function of time (dpi). F-Al = fosetyl-Al, INU = inulin, LEV = levan, Mock = water-treated, TP = time point and dpi = days post-inoculation. On the X-axis, Mock represents leaves inoculated with the mock solution, while Vi means that leaves were inoculated with spores of V. inaequalis. Total sugars are defined as the sum of the glucose, fructose and sucrose concentrations. (A) Sugar concentrations in leaf 1. (B) Sugar concentrations in leaf 2. (C) Sugar concentrations in leaf 3 (n = 6 ± SE). Letters indicate statistical differences between treatments at a certain TP (p < 0.05). Asterisks indicate treatment-independent differences between Vi and mock. This experiment was repeated 2 times with consistent results.

