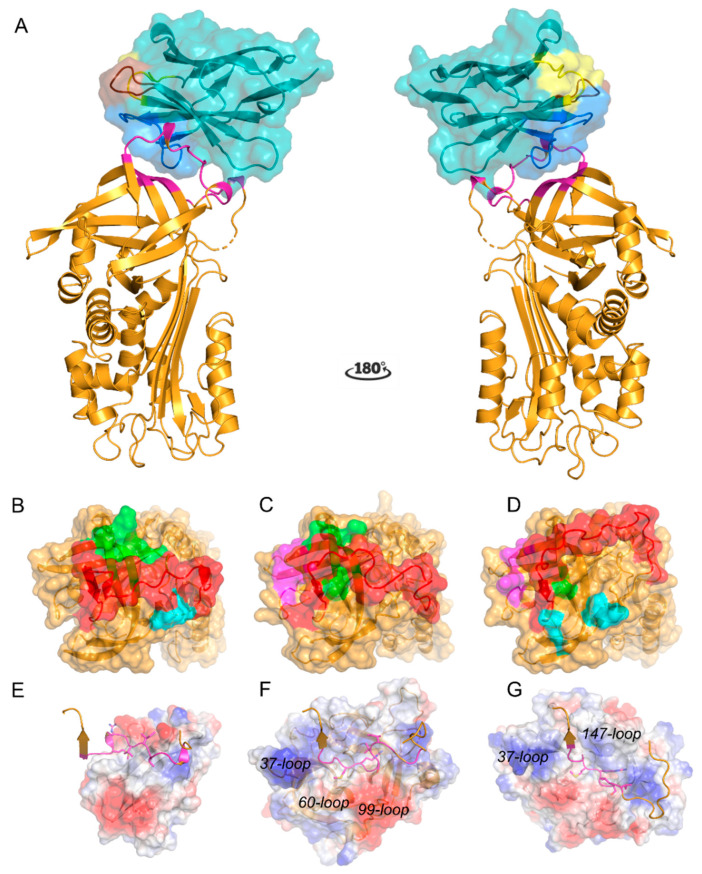
Figure 1.
Crystal structure of the PAI-1/Nb93 complex. (A) Cartoon representation of the crystal structure of PAI-1 (orange) complexed with Nb93 (teal). Residues 331 and 332 of the reactive center loop (RCL) were not observed in the crystal structure and are presented by a dashed line. Together with the cartoon representation, the biological surface of Nb93 is represented. Framework regions of Nb93 are colored cyan and teal; the complementarity-determining regions (CDR) 1, CDR2, and CDR3 are in yellow, brown, and blue, respectively. The residues in PAI-1 closer than 4 Å to Nb93 are in magenta; (B) Surface representation of the top of the PAI-1 molecule with the indicated contact regions (residues closer than 4 Å) for Nb93. Nb93 binds to the RCL in red and has adjacent contact regions in green (Thr205, Lys207, and Pro270) and cyan (Asp181 and Ser182); (C), Surface representation of the top of the PAI-1 molecule with the indicated contact regions (residues closer than 4 Å) for tissue-type plasminogen activator (tPA). The RCL is in red, the exosite region for the 37-loop of tPA is in magenta (Tyr210, Glu212, Asp222, andTyr241) and the contact regions adjacent to the RCL are in green (Thr205, Lys207, and 269-Leu-Pro-Arg-Leu-272); (D) Surface representation of the top of the PAI-1 molecule with the indicated contact regions (residues closer than 4 Å) for urokinase-type plasminogen activator (uPA). The RCL is in red, the exosite region for the 37-loop of uPA is in magenta and the contact regions adjacent to the RCL are in green (Leu272) and cyan (Ser182, Ser183, and Arg187); (E–G) Cartoon representation of the bound RCL and the charged surface representation of Nb93 (E), tPA (F), and uPA (G), respectively. Exosite loops of tPA and uPA are indicated.

