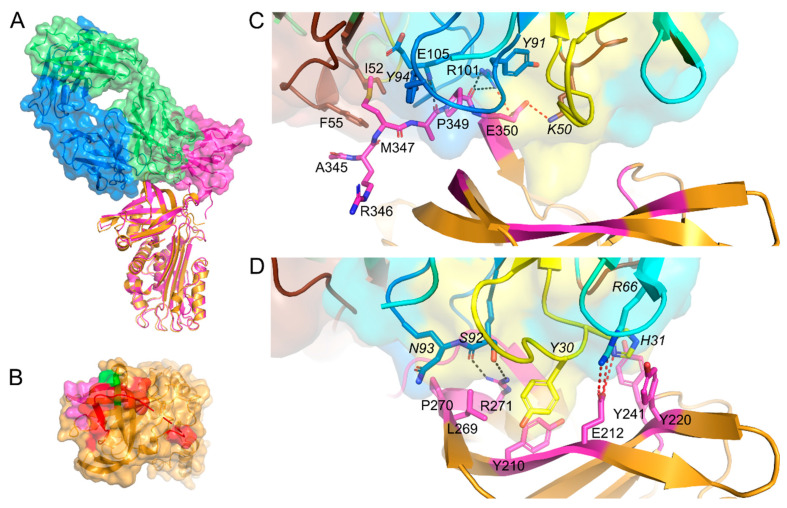
Figure 3.
Crystal structures of the PAI-1/Nb93 complex and the PAI-1/Fab-MEDI-579 complex. (A) Superimposition of the structures of the PAI-1/Nb93 (magenta) complex and PAI-1/Fab-MEDI-579 complex (PDB ID 6I8S) [19]. In the latter complex PAI-1 is orange; the heavy and the light chain of the Fab fragment are colored green and blue, respectively. Together with the cartoon representation, the biological surfaces of Nb93 and the Fab fragment are represented; (B) Surface representation of the top of the PAI-1 molecule with the indicated contact regions (residues closer than 4 Å) for MEDI-579. MEDI-579 binds to the C-terminal part of the RCL in red and has adjacent contact regions in magenta (Tyr210, Glu212, Tyr220, and Tyr241) and green (Leu269, Pro270, and Arg271); (C) Detail of the interaction between MEDI-579 and the RCL of PAI-1; (D) Detail of the interaction between MEDI-579 and residues located in the direct environment of the RCL of PAI-1. PAI-1 is colored orange, with residues closer than 4 Å to MEDI-579 in magenta. Framework regions of MEDI-579 are in green and cyan for the heavy and light chain of the Fab fragment, respectively; CDR1, CDR2, and CDR3 of the variable heavy (VH) and variable light (VL) domain are colored yellow, brown, and blue, respectively. Residues located in the VL domain are cursive. Hydrogen bonds and salt bridges are indicated by black and red dotted lines, respectively.

