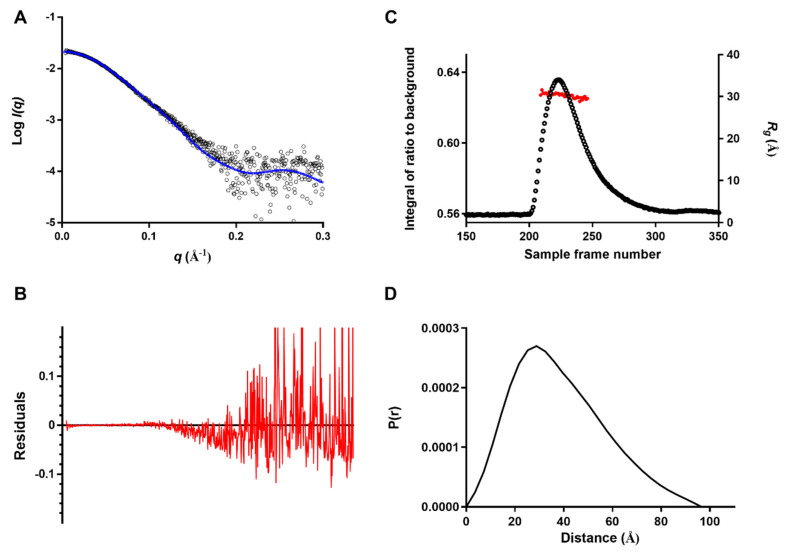
Figure 4.
Small-angle X-ray scattering (SAXS) data for the PAI-1/Nb93 complex. (A) The averaged scattering curve (black circles) was fitted with the theoretical scattering curve calculated using CRYSOL from the crystal structure of the complex (blue line); (B) The residual plot corresponding to the fit is represented by the red curve. (C) In total, 480 frames were collected during elution from an Agilent Bio SEC-3, 300 Å, 4.6 × 300 mm column. ScÅtter was used to plot the Rg as a red circle scaled on the right axis, the integral of ratio to background is shown as a black circle and scaled on the left axis. (D) The pair distribution function P(r) was solved using ScÅtter incorporating the averaged scattering curve data up to q = 0.29 Å−1.

