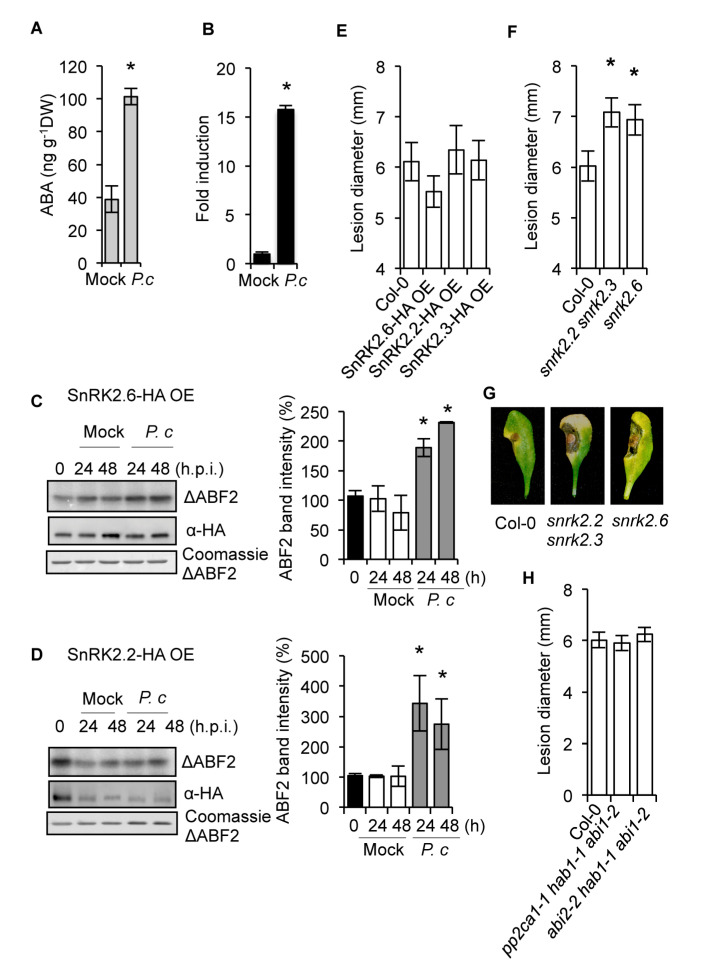
Figure 1.
Participation of SnRK2s kinases in the response of Arabidopsis plants to infection by the fungal pathogen P. cucumerina. (A) ABA accumulation determined in mock and P. cucumerina-infected Col-0 plants. (B) RT-qPCR of ABI4 in mock and in P. cucumerina-infected Col-0. (C,D) P. cucumerina-mediated activation of SnRK2.6 (C) and SnRK2.2 (D). Transgenic Arabidopsis plants expressing HA-tagged versions of the kinases were inoculated with P. cucumerina, or were mocked, and leaf samples were taken at 0, 24, and 48 h.p.i., and the protein extracts were immunoprecipitated with anti-HA antibodies. The immunoprecipitates were incubated with a His-ABF2 fragment (Gly73 to Gln 119; ΔABF2) in the presence of [γ-32P]ATP, and the proteins were resolved by SDS-PAGE. Bands corresponding to ΔABF2 fragments and to SnRK2.6 and SnRK2.2 kinases are indicated. Radioactivities of ΔABF2 fragment bands were measured with a phosphoimager, and the values were plotted on the graphs shown at the right of the figures. Error bars indicate S.E.M.; n = 3. (E) Disease resistance towards P. cucumerina of transgenic plants overexpressing SnRK2.6, SnRK2.2, and SnRK2.3 in comparison to Col-0. (F) Disease resistance towards P. cucumerina in the double snrk2.2 snrk2.3 mutant and in snrk2.6 mutant plants. (G) Representative leaves from each genotype at 12 days following inoculation with P. cucumerina. (H) Disease resistance towards P. cucumerina in the triple PP2C mutants pp2ca1 1hab1 1abi1-2 and abi2-2 hab1 abi1-2. For the bioassays with P. cucumerina, lesion diameter of 25 plants per genotype and four leaves per plant were determined 12 d following inoculation with P. cucumerina. Data points represent the average lesion size ± SE of measurements. An ANOVA was conducted to assess significant differences in the activation of SnRKs, ABA accumulation, ABI4 transcript accumulation, and disease symptoms, with a priori p < 0.05 level of significance; the asterisks * above the bars indicate statistically significant differences regarding mock treatments or Col-0 plants. Asterisks above the bars indicate different homogeneous groups with statistically significant differences.

