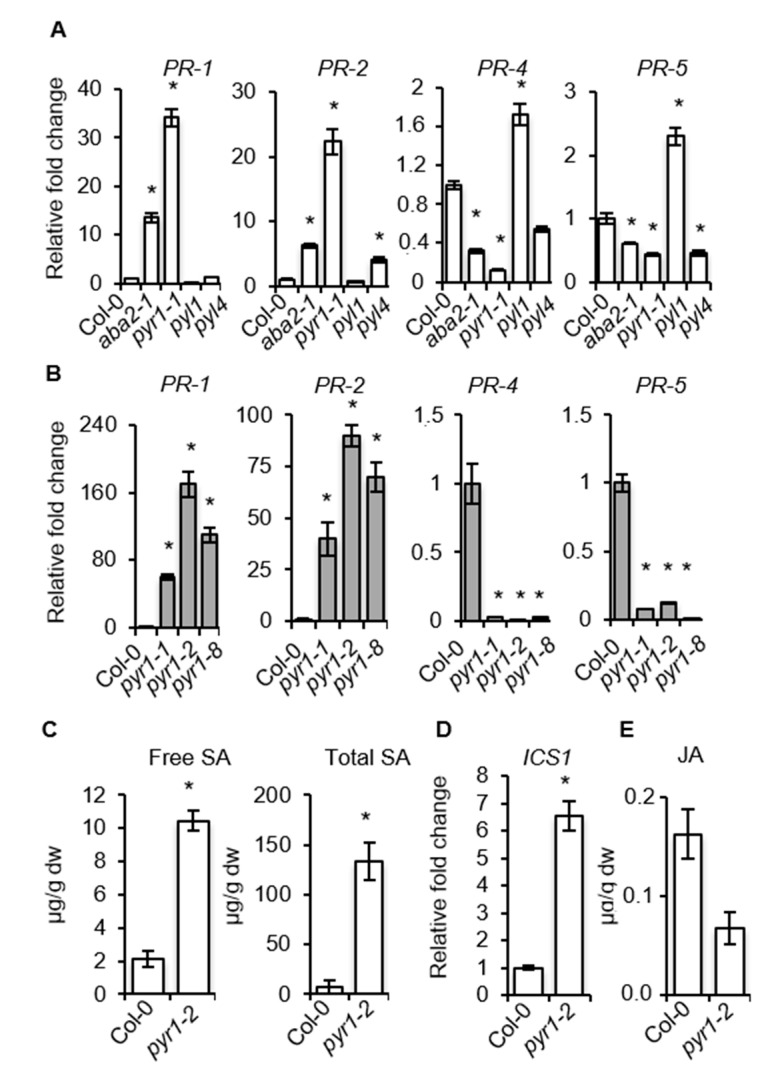
Figure 5.
Expression of SA-responsive and ET-responsive genes in pyr1 and aba2 mutants. (A,B) RT-qPCR analysis showing constitutive expression levels of PR-1, PR-2, PR-4, and PR-5 genes in (A) Col-0, aba2-1, pyr1-1, pyl1, and pyl4 plants, and (B) their comparative expression levels in the allelic pyr1-1, pyr1-2, and pyr1-8 mutants. Data represent mean ± SD; n = 3 replicates. The expression was normalized to the constitutive ACT2 and ACT8 genes and then to the expression in Col-0 plants. (C–E) Accumulation of free SA, total SA, and total JA in Col-0 and pyr1-2 plants. Data represent the average of three biological replicates. An ANOVA was conducted to assess significant differences in RT-qPCR and hormone analysis, with a priori p < 0.05 level of significance; the asterisks * above the bars indicate statistically significant differences regarding Col-0 plants.

