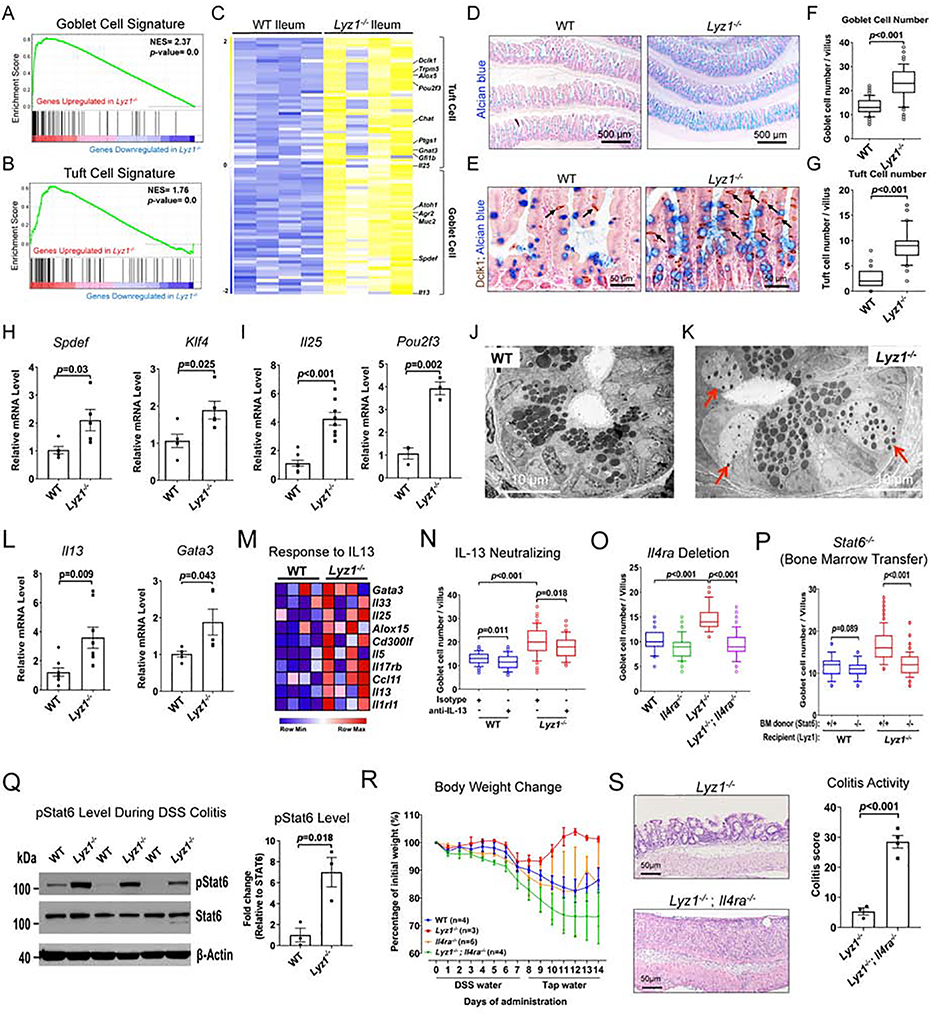
Figure 2. Elevated type 2 immune response in Lyz1−/− intestinal mucosa mediates anti-colitogenic protection.
(A-B) Elevated goblet and tuft cell signatures in Lyz1−/− ileum in GSEA analysis (p=0.0). (C) Differential expression of goblet and tuft cell specific genes along with IL-25 and IL-13 in WT and Lyz1−/− ileum (N=4 for each genotype). (D-E) Representative Alcian blue (goblet) and DCLK1 (tuft) staining in WT and Lyz1−/− ileum. (F-G) Quantification of the number of goblet and tuft cells per villus in WT and Lyz1−/− littermates (N=5 mice per genotype). (H-I) Real-time qPCR for goblet and tuft cell specific genes (N=3~6 per genotype). (J-K) Transmission electron microscopy of the WT and Lyz1−/− ileal crypts demonstrating cells with granules characteristic of both goblet and Paneth cells. The electron dense granules were surrounded by expanded halos (red arrows) in abnormal Paneth cells in the Lyz1−/− (representative of N=3 for each genotype). (L) qPCR analysis of IL-13 and Gata3 mRNA in WT and Lyz1−/− ileum (N=3–6 for each genotype). (M) Differential expression of IL-13 responsive genes in WT and Lyz1−/− ileum (N=4 per genotype). (N) Goblet cell numbers (counted from 50 villi per field of vision per mouse) in WT or Lyz1−/− mice treated with neutralizing anti-IL-13 antibody, anti- CD90.2, or isotype control (N=2 for each condition per genotype). (O) Goblet cell numbers (counted from 50 villi per field of vision per mouse) in WT, Lyz1−/−, Il4ra−/−, or Lyz1−/−; Il4ra−/− mice (N=3 for each genotype). (P) Goblet cell numbers (counted from 50 villi per field of vision per mouse) in WT or Lyz1−/− bone marrow chimeras with hematopietic cells from Stat6+/+ or Stat6−/− donors (total N=4 mice for each condition; 2 independent experiments). (Q) Western blotting analysis of pStat6 from the colons of DSS-treated WT and Lyz1−/− mice (N=3 for each genotype). (R) Body weight change in WT, Lyz1−/−, Il4ra−/−, or Lyz1−/−; Il4ra−/− mice treated by 3% DSS and during recovery. (S) Representative H&E staining and colitis histological activity score in DSS-treated Lyz1−/− and Lyz1−/−; Il4ra−/− mice. All bar graphs display mean ± SEM from at least two independent experiments. See also Figure S2.

