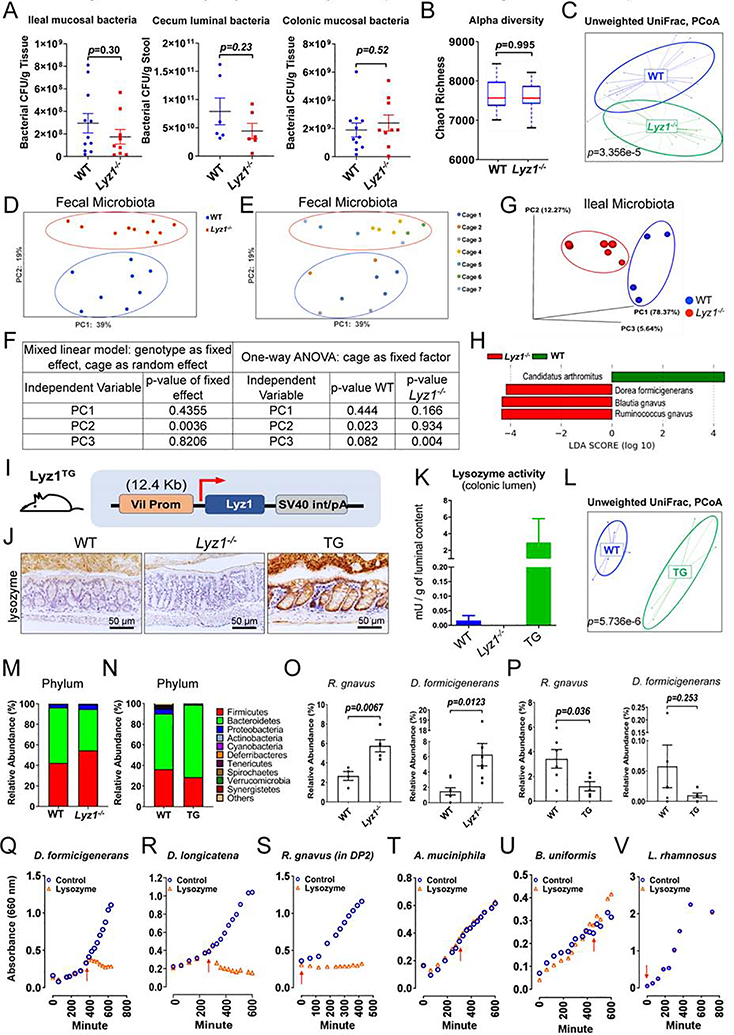
Figure 5. Paneth cell lysozyme deficiency or overproduction alters gut microbiota composition.
(A) Bacterial loads were determined in ileal and colonic mucosa and cecal lumen in WT and Lyz1−/− mice (N=6–10 in each group). (B-H) 16S amplicon profiling of fecal or ileal luminal microbiota from WT and Lyz1−/− mice. (B) Chao1 index (alpha diversity) (fecal microbiota, n=10– 12). (C) Unweighted UniFrac analysis of fecal microbiota from WT and Lyz1−/− mice (n=14–16). (D-E) PCoA analysis of fecal microbiota with consideration for genotype and cage effect (total of 8 WTs in 3 cages; 10 Lyz1−/−s in 4 cages). (F) Mixed linear model analysis using genotype as fixed and cage as random effect. One-way ANOVA showed that cage effects contributed to differences among mice of the same genotype. (G) PCoA analysis of ileal luminal microbiota from separately housed adult Lyz1−/− and WT littermates. (H) LDA of ileal luminal bacteria with species contracting (Candidatus Arthromitus) or expanding (R. gnavus, B. gnavus, and D. formicigenerans) in Lyz1−/−mice. (I) Schematic diagram of the Villin-Lyz1TG transgenic (TG) construct. (J) Lysozyme immunohistochemistry for WT, Lyz1−/−, and TG mouse colons (representative of N>3 for each genotype). (K) Lysozyme enzymatic activity in the colonic lumen of WT, Lyz1−/−, and TG mice (N=3 for each genotype). (L) Unweighted UniFrac analysis (16S amplicon profiling) of WT and TG mouse fecal microbiota. (M) Relative phyla abundance in the feces of separately housed WT and Lyz1−/− mice (N=4–8). (N) Relative phyla abundance of WT and TG mice (N=5–6). (O) Relative abundance of R. gnavus and D. formicigenerans in WT and Lyz1−/− fecal microbiota (N=4–10 per genotype). (P) Relative abundance of R. gnavus and D. formicigenerans in WT and TG fecal microbiota (N=5–6). (Q-V) Growth sensitivity of selected bacteria to lysozyme based on OD 660nm readings. Red arrowhead indicated the addition of 200 μg/ml lysozyme (data from 2–4 independent experiments). All bar graphs display mean ± SEM from at least two independent experiments. See also Figure S5.

