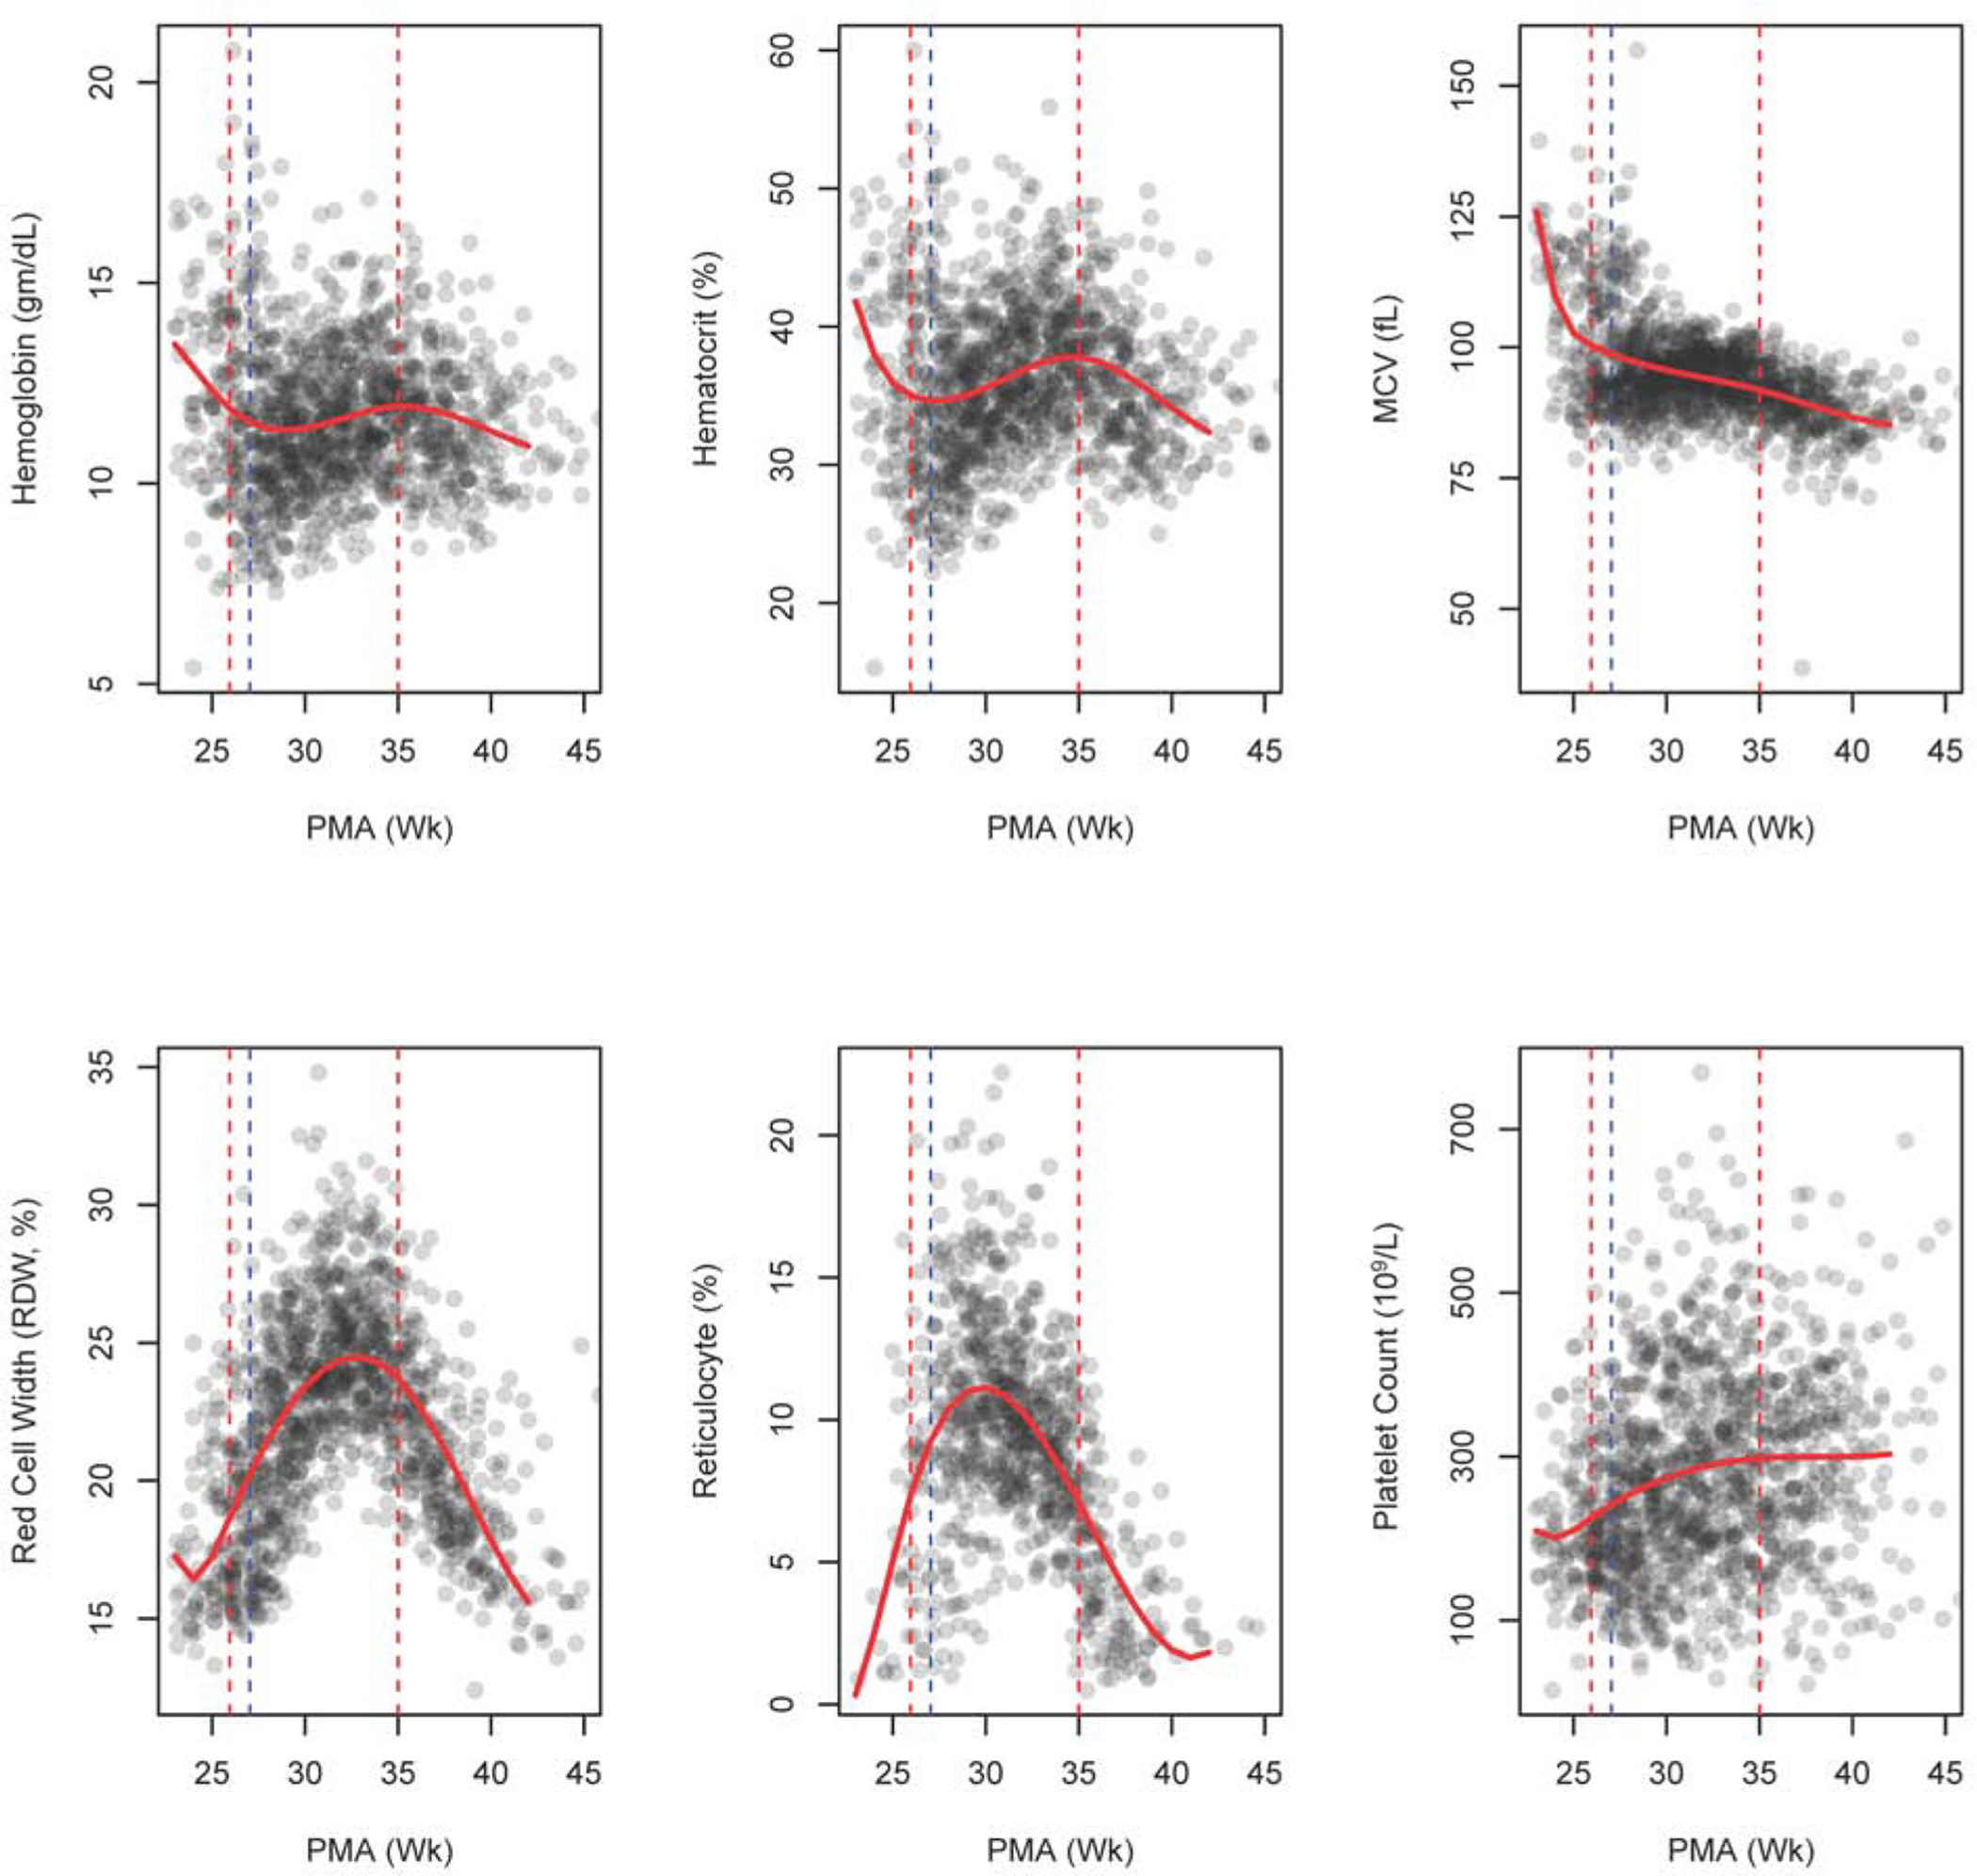
Figure 2.

Scatter plot with non-parametric trend line for hematological indices. The red dashed vertical lines show the start and end of r-HuEPO therapy. The blue dashed vertical line represents start of iron supplementation. (PMA, postmenstrual age)
