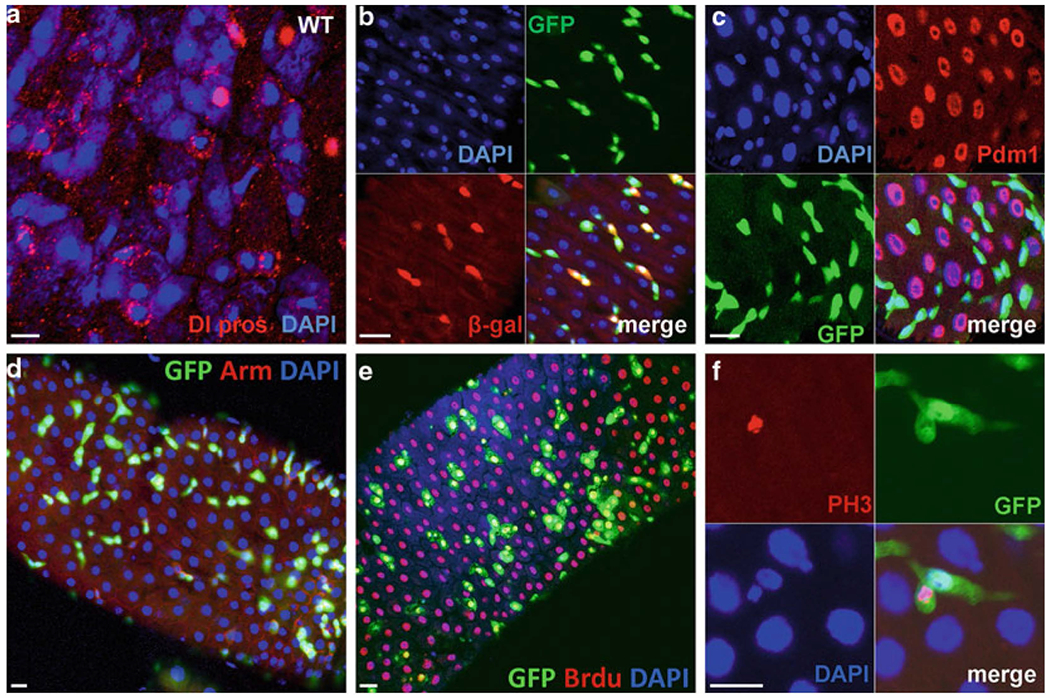
Fig. 2.

ISCs markers and proliferative cell marker expression in the midgut. (a) Wild-type gut with expression of anti-DI (red-punctate structures resembling endocytic vesicles for ISCs), anti-prospero (red-nuclear staining, ee cells); Dapi staining, blue. (b) Gut stained for 10X STAT-GFP (green-labeled the ISCs and EBs) and Su(H)GBE-LacZ (red-labeled EBs only), Dapi (blue). (c) Gut staining of esg-GAl4-UAS-GFP flies with anti-Pdm1. GFP mark the ISCs and EBs (green), Pdm1-mark the EC cells (Red), Dapi (blue). (d) kr-Gal4-UAS-GFP gut stained for GFP (green-labeled the ISCs and EBs), anti-Arm (red), and Dapi (blue). (e) BrdU pulse to detect the DNA synthesis in the gut using 10× STAT-GFP flies, anti-BrdU (red), GFP (green), Dapi (blue). (f) 10× STAT-GFP (green) gut stained with phospho-histone H3 (red) to detect the mitosis. Scale bars: 10 μm.
