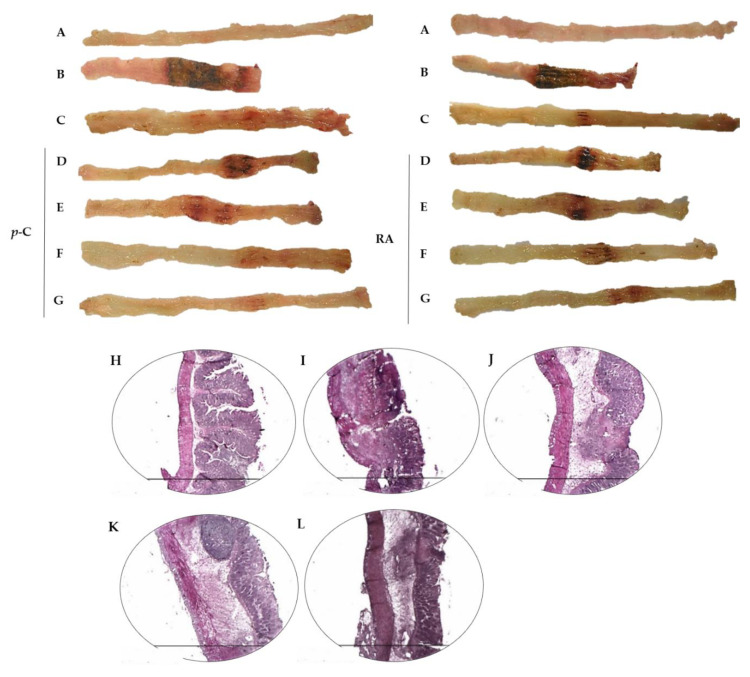
Figure 1.
Representative images of rat colons from non-colitic group (A); colitic groups (5% Tween 80 or 0.9% NaCl treated groups) (B); prednisolone 2 mg/kg (C); p-C or RA (RA) 25 mg/kg (D), 50 mg/kg (E), 100 mg/kg (F), and 200 mg/kg (G) subjected to TNBS-induced ulcerative colitis model. The figure also shows representative hematoxylin–eosin (HE)-stained photomicrographs (n = 3 per group) from (H) non-colitic; (I) colitic; (J) prednisolone 2 mg/kg; (K) p-C 200 mg/kg; and (L) RA 200 mg/kg. 40× magnification. Scale: 1500 µm.

