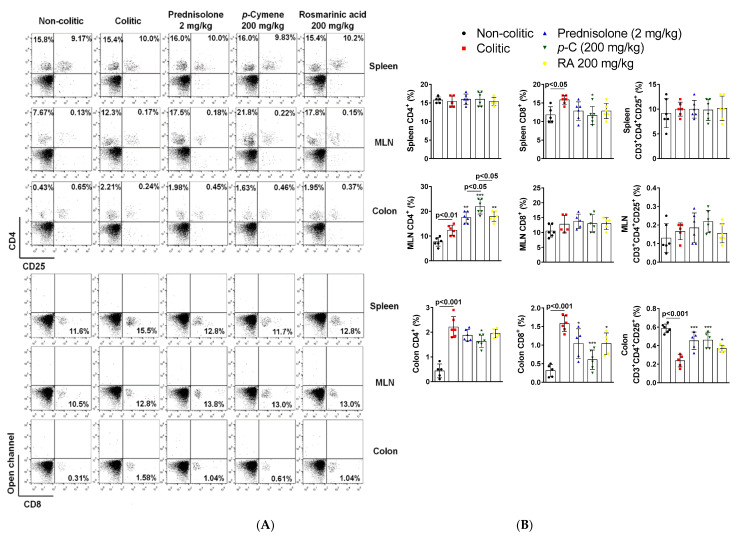
Figure 7.
Effect of oral administration of p-C and RA in the modulation of T cell populations in a TNBS-induced ulcerative colitis rat model. (A) Representative dot plots from flow cytometry analysis (FACS) analysis of T lymphocytes gated for cluster of differentiation (CD)4+, CD8+, and CD3+CD4+CD25+ cells; (B) T cell percentages (%) in the assessed samples (colon, spleen, and mesenteric lymph nodes (MLN)). Data are expressed as mean ± standard error percentage of the total number of cells, having been analyzed by one-way ANOVA followed by Dunnett’s or Tukey’s test. *** p < 0.001, ** p < 0.01, * p < 0.05 compared to colitic control groups (n = 5–6).

