Figure 1.
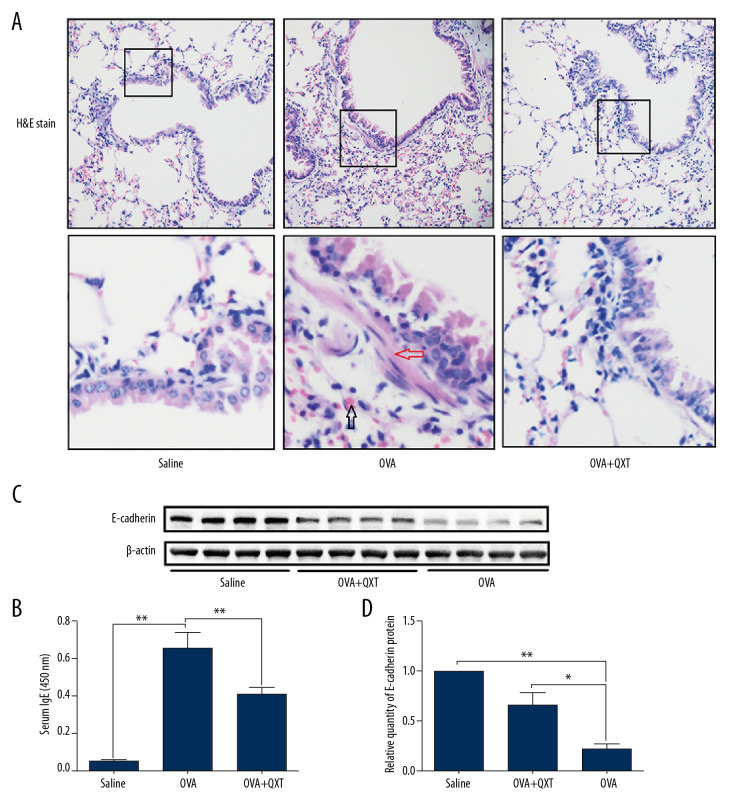
QXT increased E-cadherin expression in OVA-challenged mice. (A) The lung tissues of OVA-challenged mice were examined with hematoxylin and eosin (×100). Infiltration of eosinophils was shown by black arrows and smooth muscle thickening was shown by red arrows (n=8). (B) Serum IgE levels were estimated using ELISA (n=8). (C) E-cadherin levels were determined by Western blot analysis (n=8). (D) E-cadherin protein concentrations were quantified by using Image J software and normalized to β-actin. Data are shown as the mean±standard, * P<0.05, ** P<0.01.

