
Figure 4.
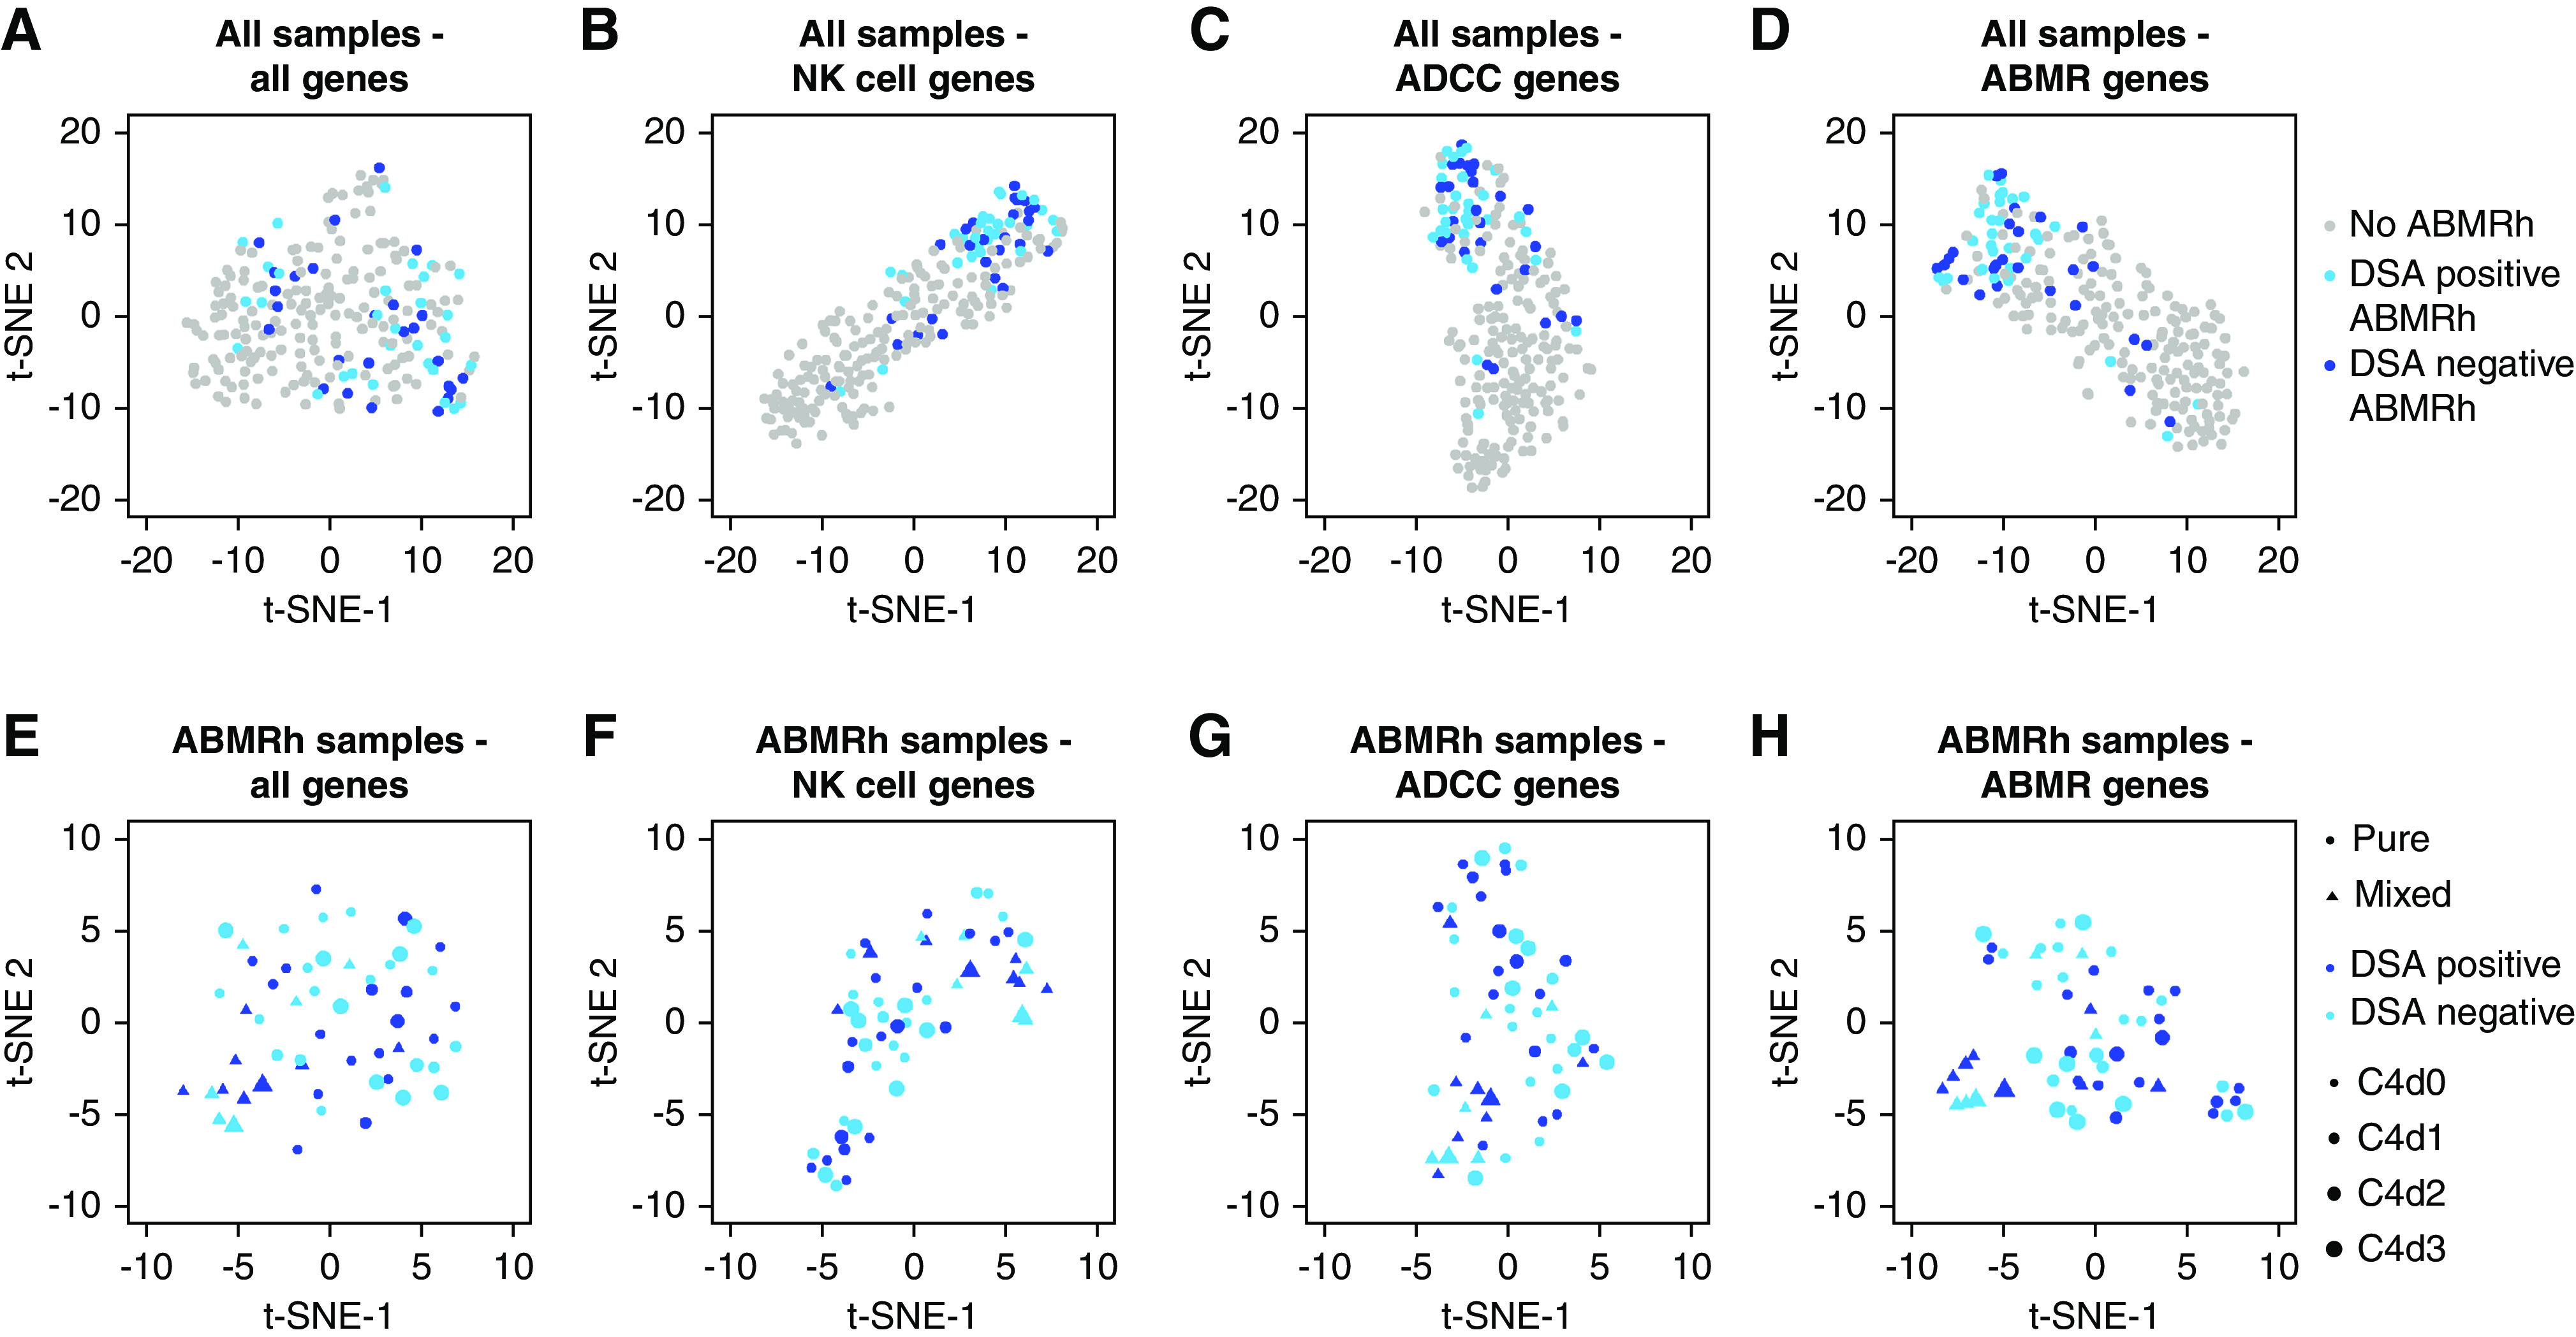
HLA-DSA status does not explain molecular heterogeneity within ABMRh. (A–D) Clustering of all allograft biopsy specimens (n=224) based on expression of (A) all genes and (B–D) gene subsets distinguished most ABMRh biopsy specimens. Ten ABMRh cases were persistent outliers. (E–H) Among ABMRh biopsy specimens (n=56), transcriptional heterogeneity was not explained by HLA-DSA or C4d severity, whereas biopsy specimens with mixed rejection (concomitant borderline/TCMR) colocalize. t-SNE was used for dimensionality reduction. Points represent individual biopsies.