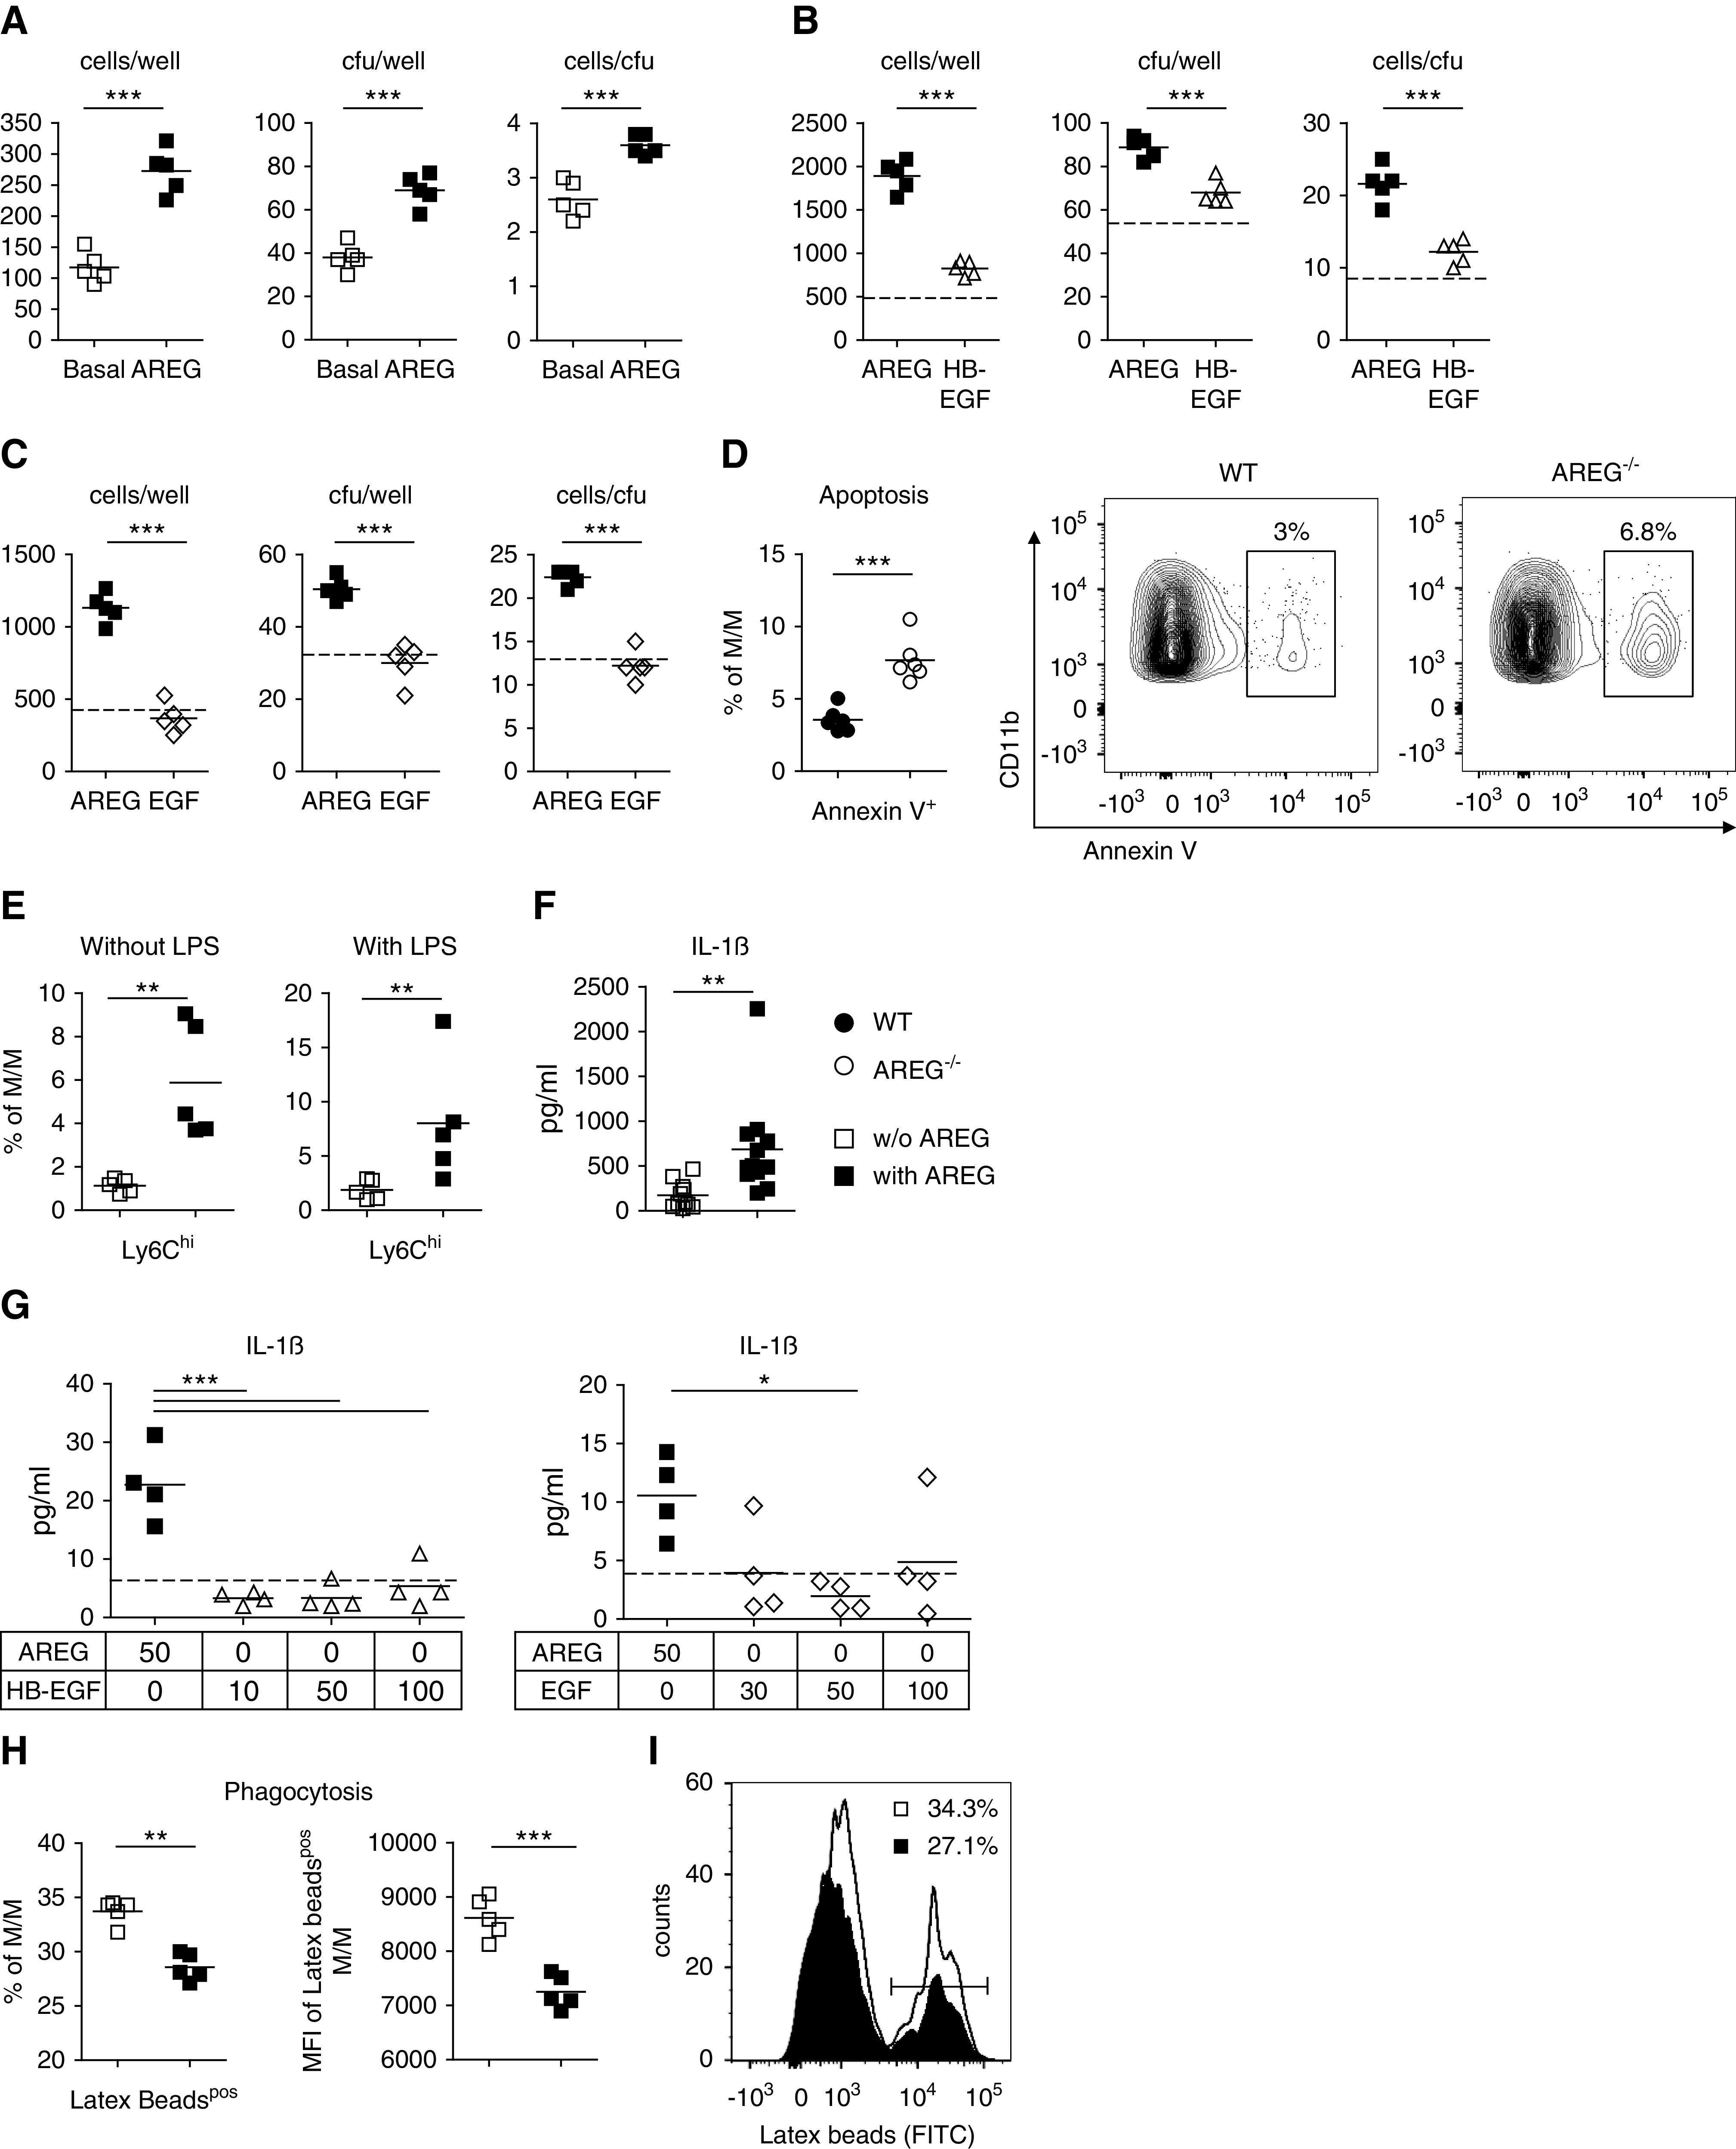
Figure 5.

AREG enhances M/M proliferation and induces a proinflammatory M1 phenotype. (A) In vitro M/M proliferation at 6 days after stimulation with 50 ng/ml AREG, as measured by the number of cells per well, CFU per well, and cells per CFU. (B) In vitro M/M proliferation at 6 days after stimulation with 50 ng/ml AREG compared with 50 ng/ml HB-EGF, as measured by the number of cells per well, CFU per well, and cells per CFU. (C) In vitro M/M proliferation at 5 days after stimulation with 50 ng/ml AREG compared with 50 ng/ml EGF, as measured by the number of cells per well, CFU per well, and cells per CFU. Dotted lines in (C and D) indicate basal conditions without addition of EGFR ligands. (D) Quantification and representative FACS plot of apoptosis from blood M/M of naïve mice with the indicated genotypes. (E) FACS quantification of Ly6Chigh M1-type M/M after 48 hours in vitro stimulation with or without LPS, in the presence or absence of 50 ng/ml AREG. (F) IL-1β secretion as measured by ELISA in the supernatant of M/M after 24 hours in vitro stimulation with or without 50 ng/ml AREG. (G) IL-1β secretion as measured by ELISA in the supernatant of M/M after 24 hours in vitro stimulation with 50 ng/ml AREG compared with indicated concentrations of HB-EGF (left) and EGF (right) in nanograms per milliliter. Dotted line indicates IL-1β levels at basal conditions. (H) Percentages of latex beads (FITC)pos M/M (left) and latex bead (FITC) mean fluorescence intensity (MFI) within latex beadpos M/M (right) after 48 hours in vitro culture with or without 50 ng/ml AREG. (I) Representative histogram of latex beads (FITC)-positive CD11b+ M/M. Symbols represent individual animals or cell culture preparations, horizontal lines show mean values. *P<0.05; **P<0.01; ***P<0.001. WT, wild-type.
