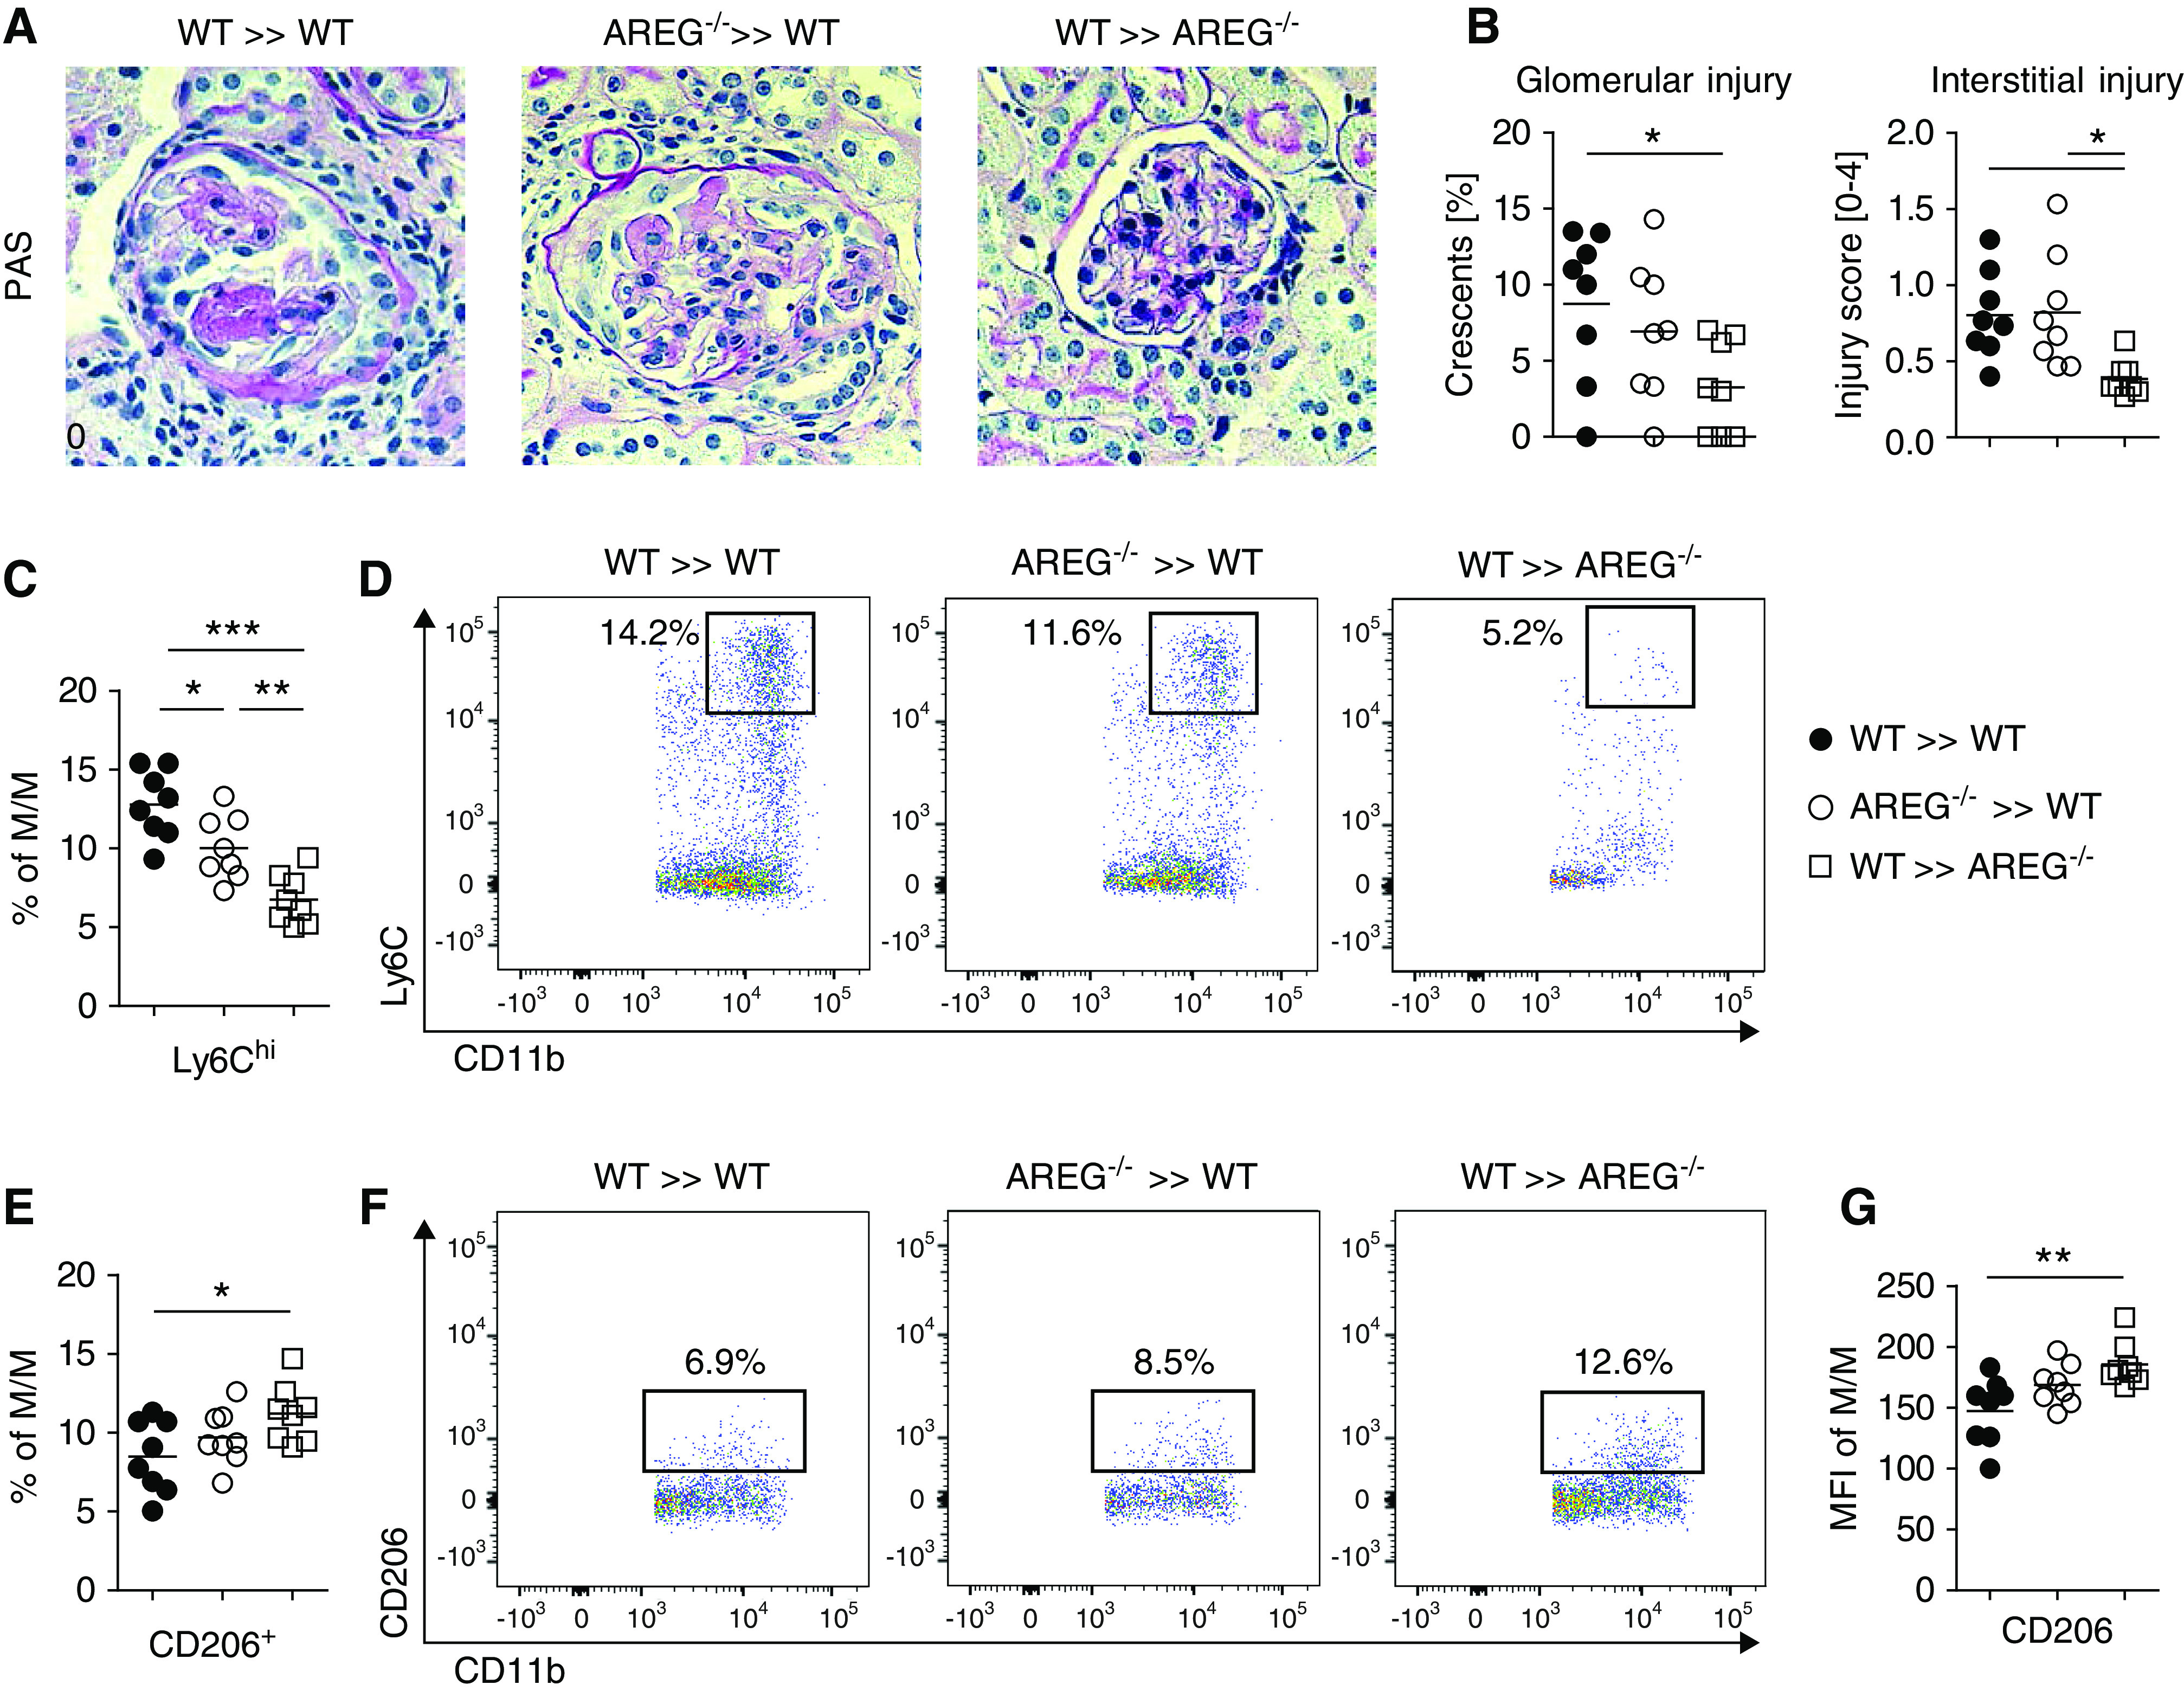
Figure 6.

AREG from nonhematopoietic cells enhances M/M responses and aggravates NTN. (A) PAS-stained sections of nephritic kidneys from the indicated bone marrow donor/recipient combinations at day 7 of NTN (original magnification ×400). (B) Quantification of glomerular crescents and interstitial injury. (C) FACS quantification of renal Ly6Chigh inflammatory M/M of the indicated groups of mice. (D) Representative FACS plots of renal Ly6Chigh inflammatory M/M. (E) FACS quantification of renal CD206/Mannose receptor+ M2-type M/M of the indicated groups of mice. (F) Representative FACS plots of renal CD206/Mannose receptor+ M2-type M/M. (G) Mean fluorescence intensity (MFI) of CD206/Mannose receptor within renal M/M. Symbols represent individual animals, horizontal lines show mean values. *P<0.05; **P<0.01; ***P<0.001. PAS, periodic acid–Schiff; WT, wild-type.
