Figure 3.

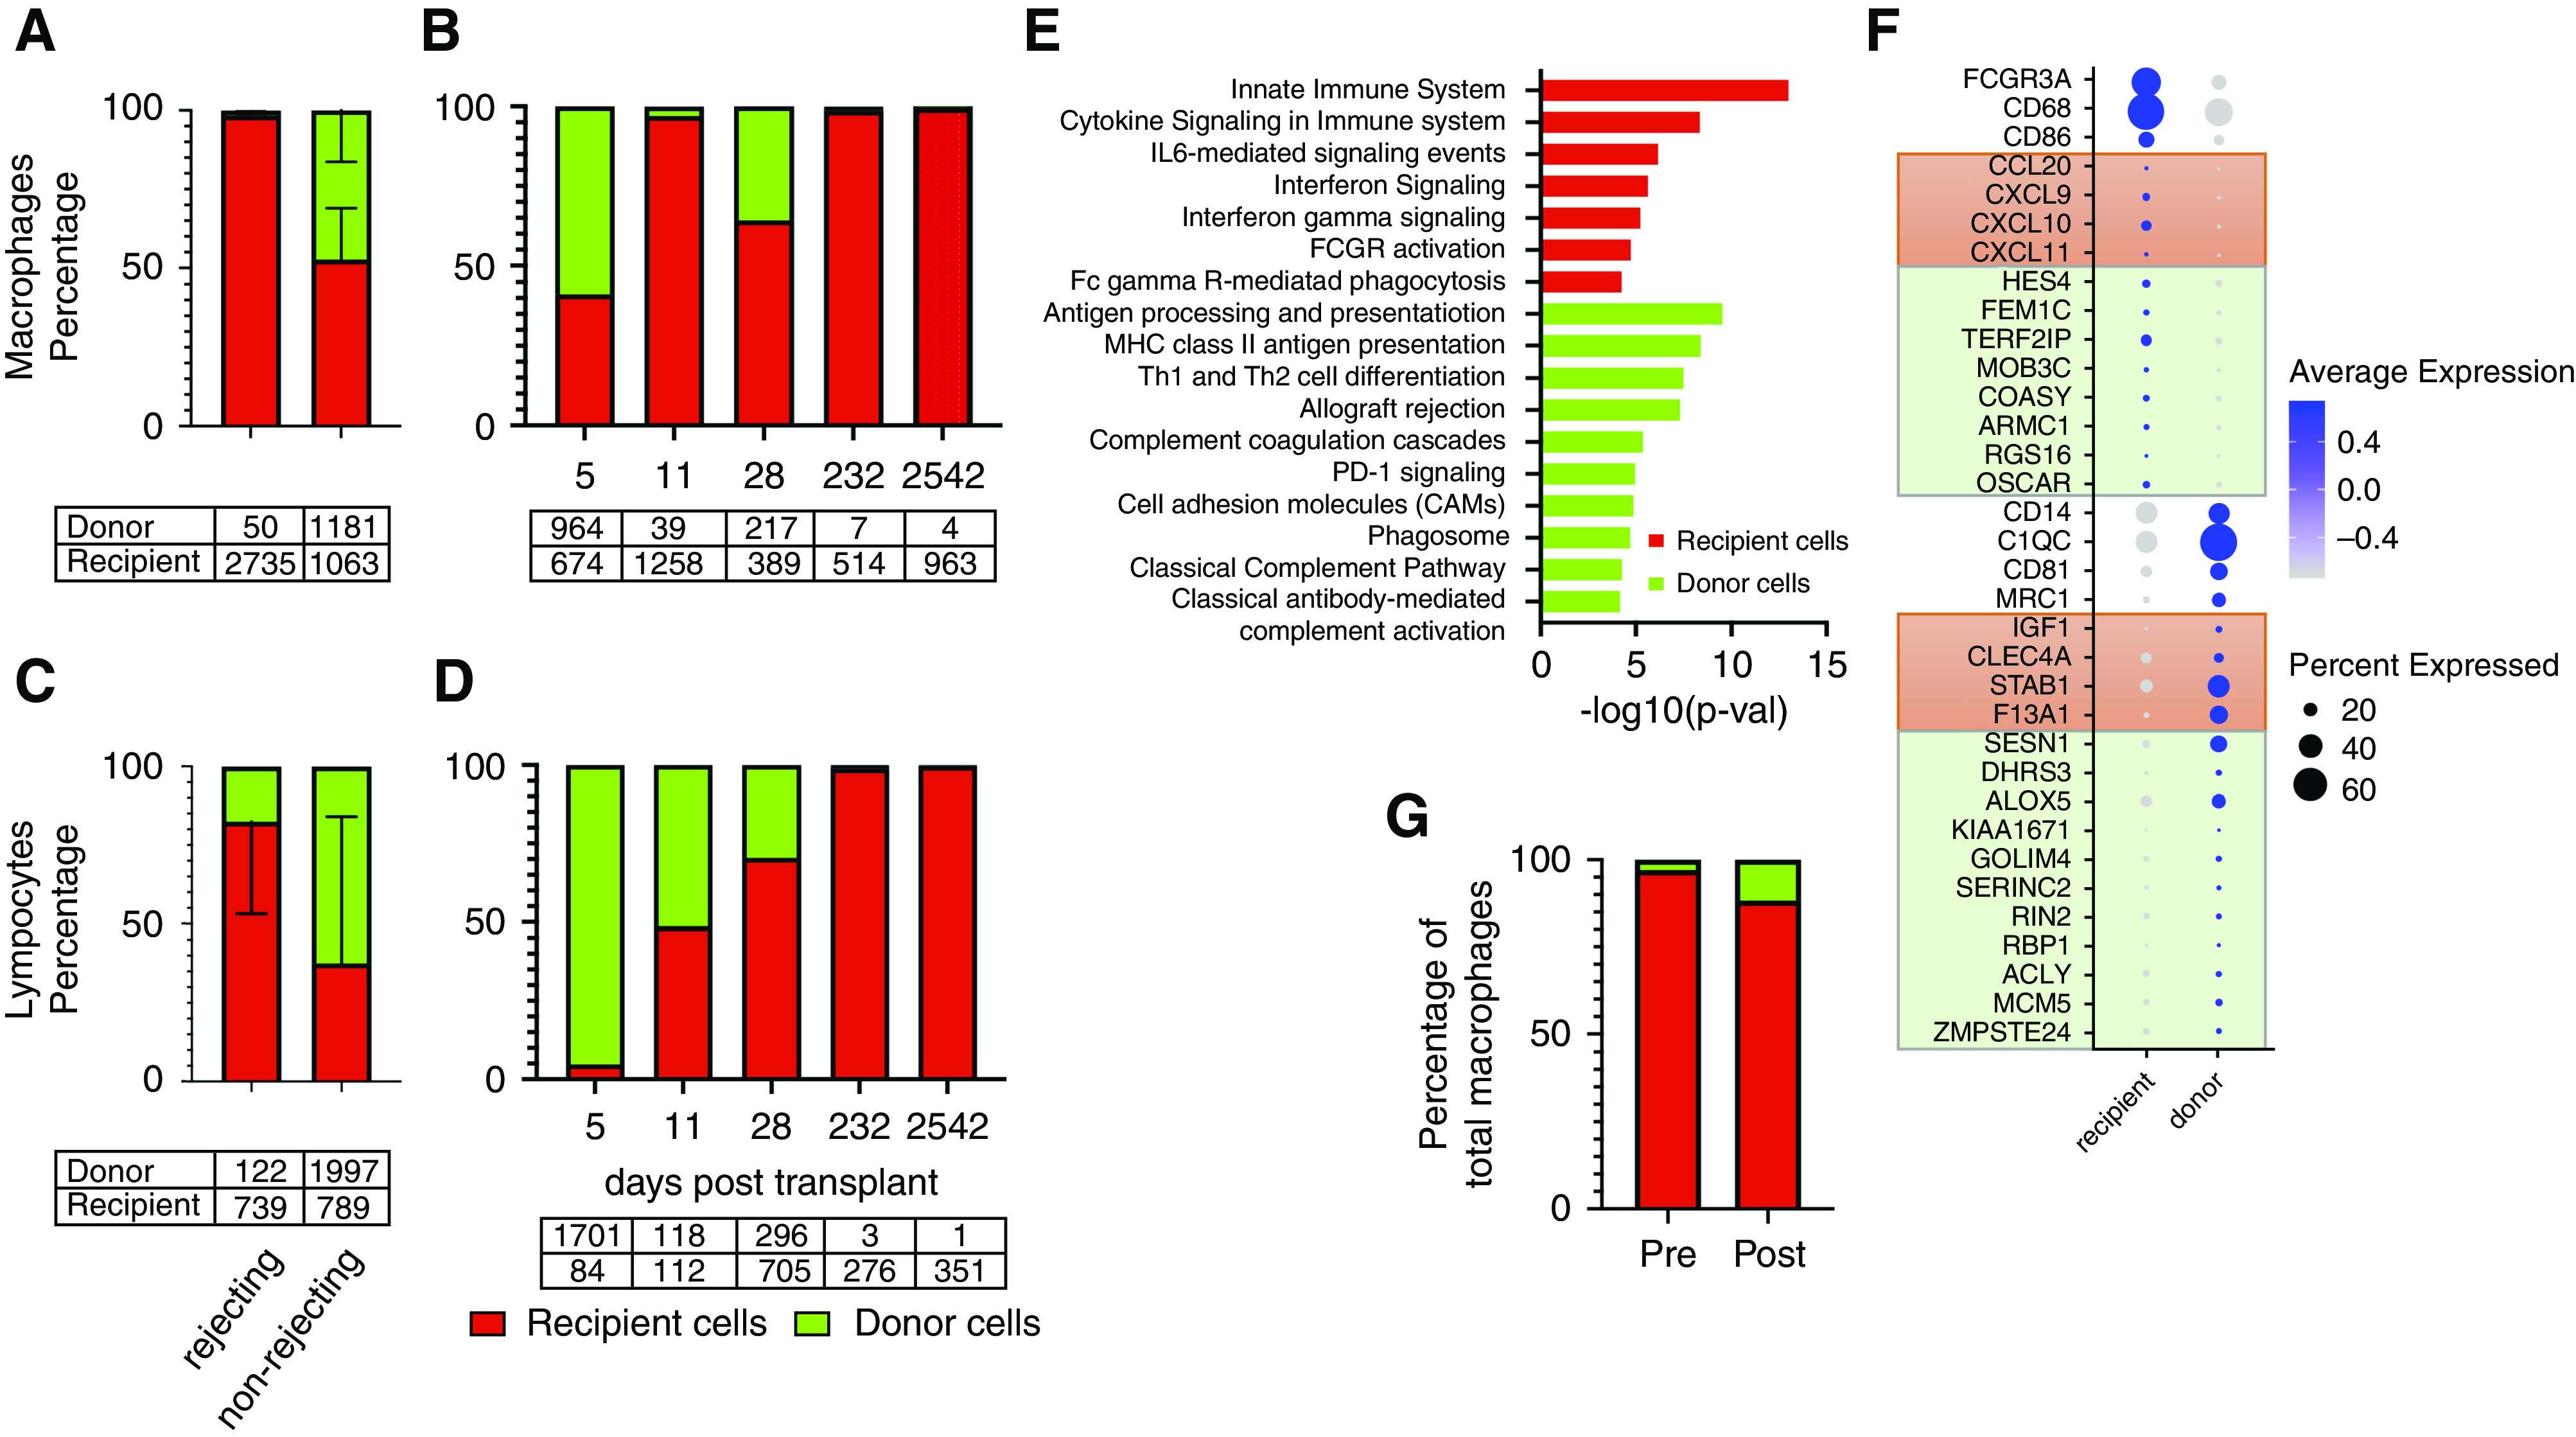
Donor-origin macrophage and lymphocyte populations vary with time and rejection status. (A) Macrophage proportions vary according to rejection status. Recipient-cell error bars in upward direction and donor-cell error bars in downward direction. (B) The proportion of donor/recipient macrophages in each of the five biopsy specimens according to time (days) post-transplant. (C) The proportions of donor and recipient lymphocytes according to rejection status. (D) The proportion of donor/recipient T cells in each of the five biopsies according to time (days) post-transplant. Tables under (A–D) are total cell numbers. (E) Macrophage pathway analysis by cell origin. Differential gene testing between donor and recipient macrophages reveal genes involved in immune-related pathways (ToppGene Suite pathway analysis, Bonferroni P=0.049 or less). (F) Dot plot of genes that define donor and recipient macrophages. Orange boxes include genes differentially expressed in classically activated and wound-healing macrophages, respectively. Light green boxes include highly expressed genes from spectrum of macrophage phenotypes as described by Xue et al.18 (G) Serial biopsy specimens in the same patient at rejection (ABMR) diagnosis (pretreatment) and 1 month post-treatment demonstrates donor macrophage proportion increases postrejection treatment. Pretreatment biopsy was performed 2 years 7 months (945 days) post-transplant and the post-treatment biopsy was performed 1 month after the first biopsy (974 days). MHC, major histocompatibility complex; PD-1, programmed cell death protein 1; p-val, P value; Th1, type 1 CD 4 T helper cell; Th2, type 2 CD 4 T helper cell.
