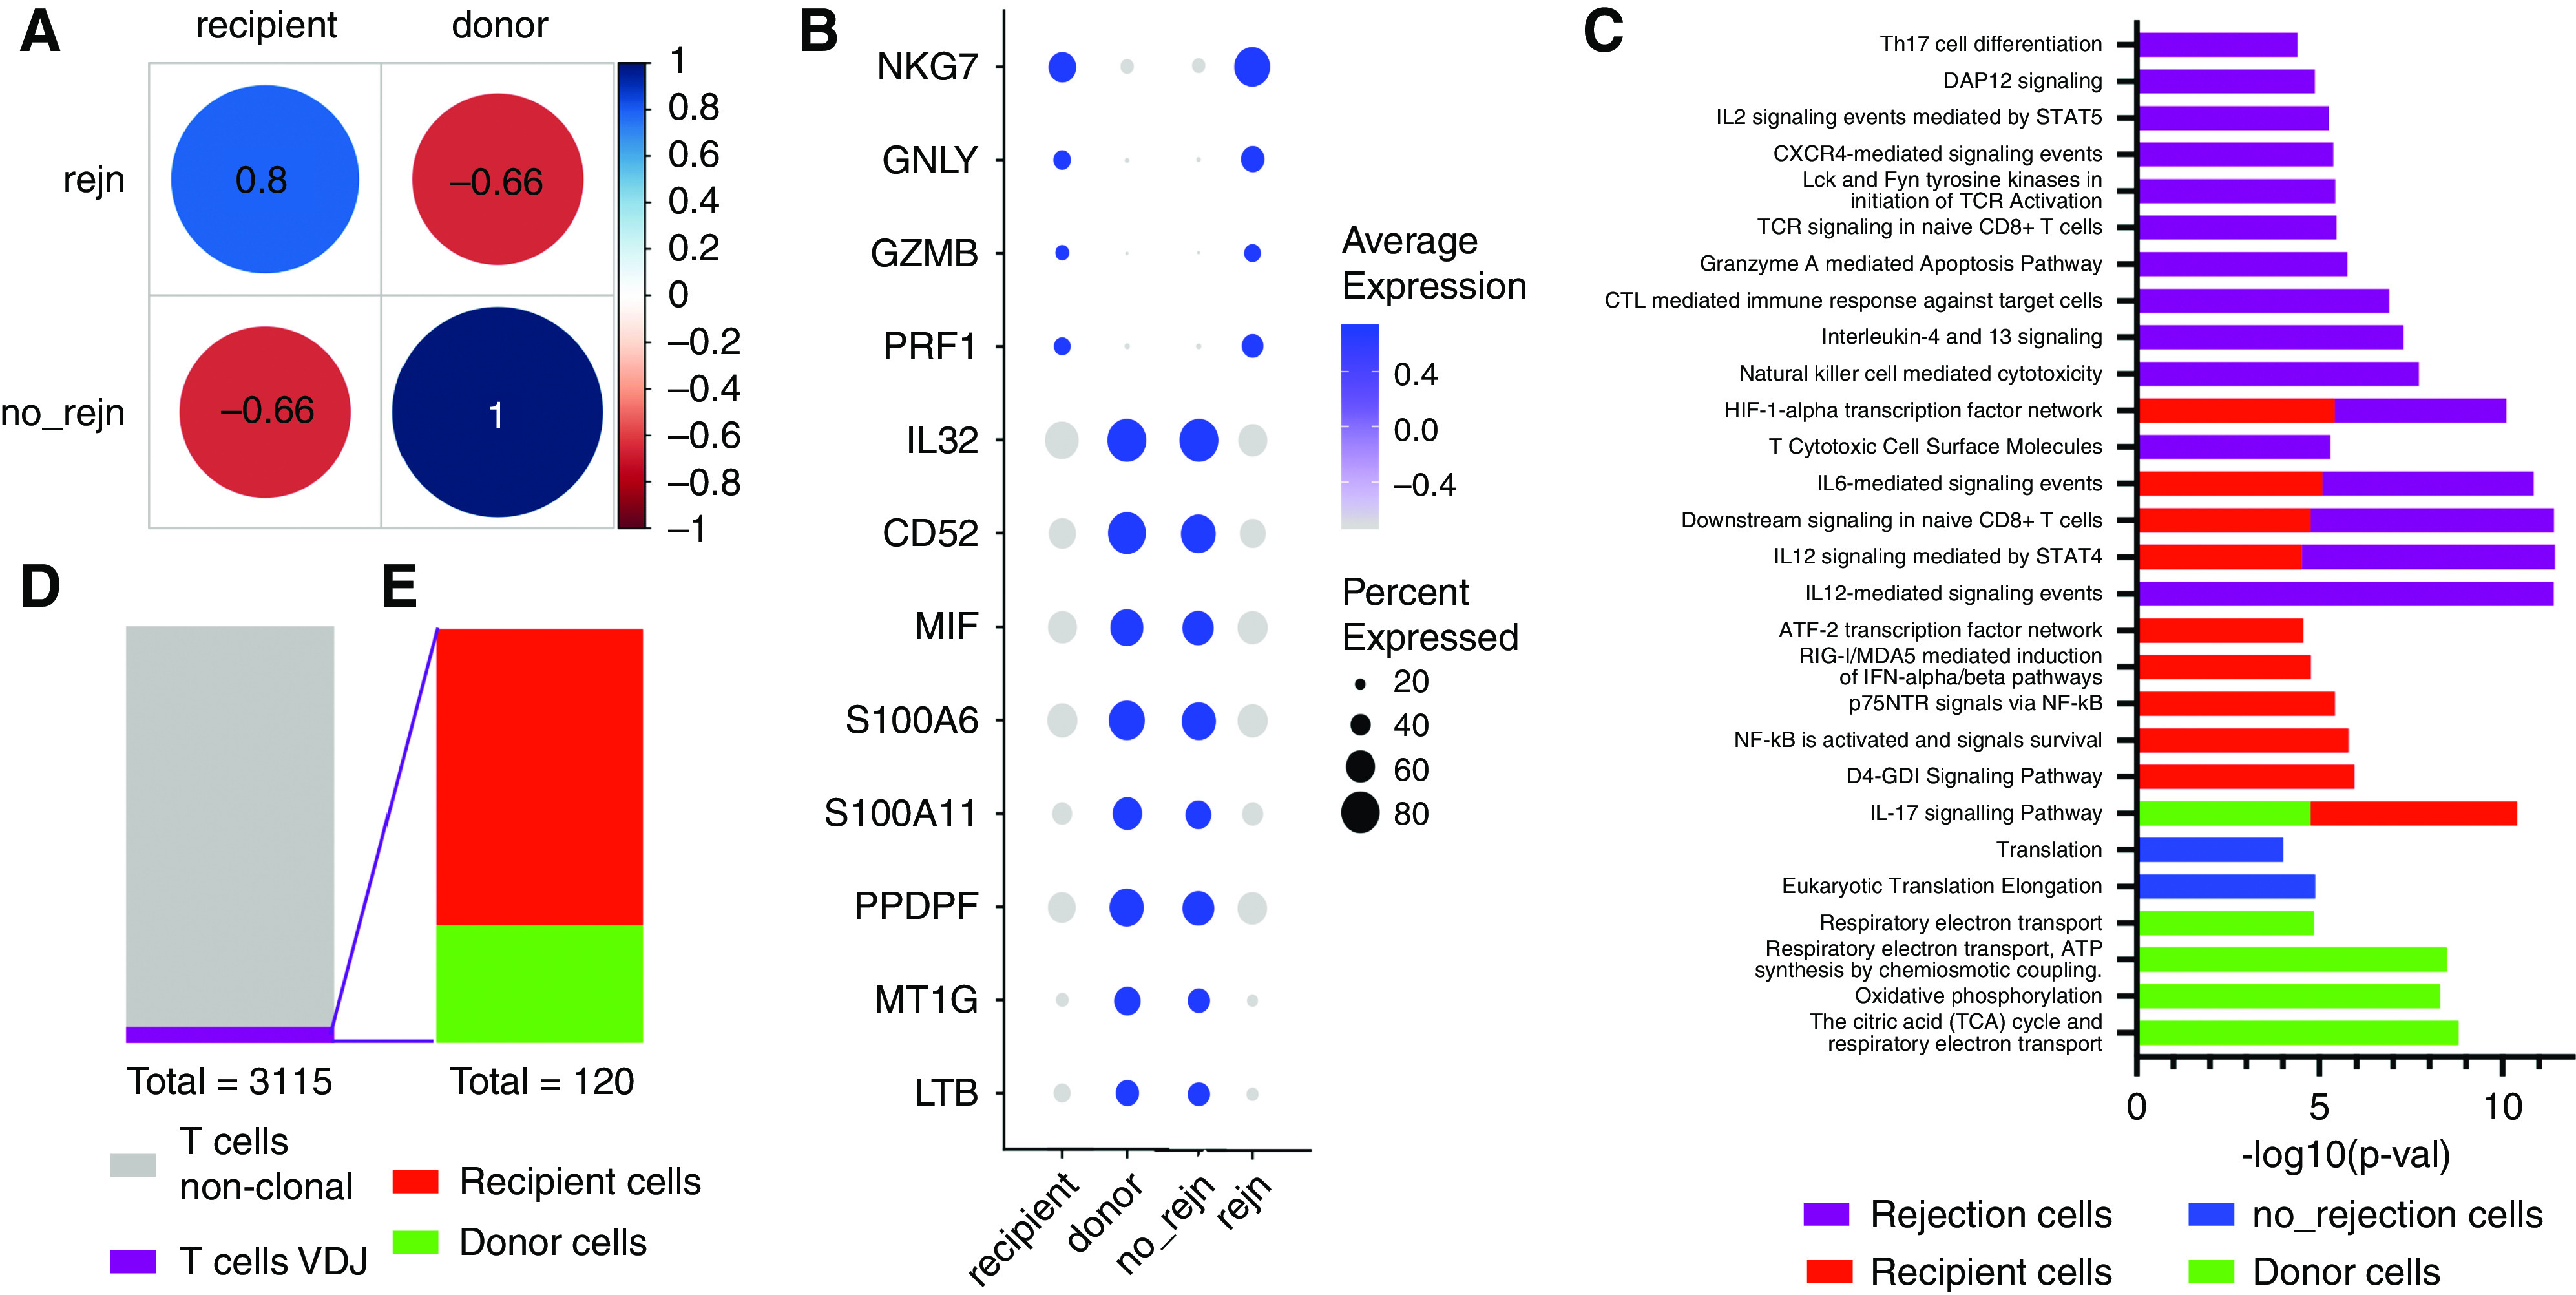
Figure 5.

T lymphocyte transcriptional states vary according to donor or recipient origin and rejection status. (A) Spearman correlation analysis of T cells from rejection versus nonrejection samples and recipient versus donor T cells (correlation coefficient are numbers within circles). (B) Select genes from top 20 differentially expressed genes from each group represented in (A): recipient T cells, donor T cells, rejecting T cells (rejn), and nonrejecting T cells (no_rejn). (C) Pathway analysis of significantly differentially expressed genes (Bonferroni P= 0.043 or less). (D) Highlights the proportion (120/3115) of clonal T cells based on VDJ sequencing and (E) proportion of T cell clones from recipient (86) and donor cells (34).
