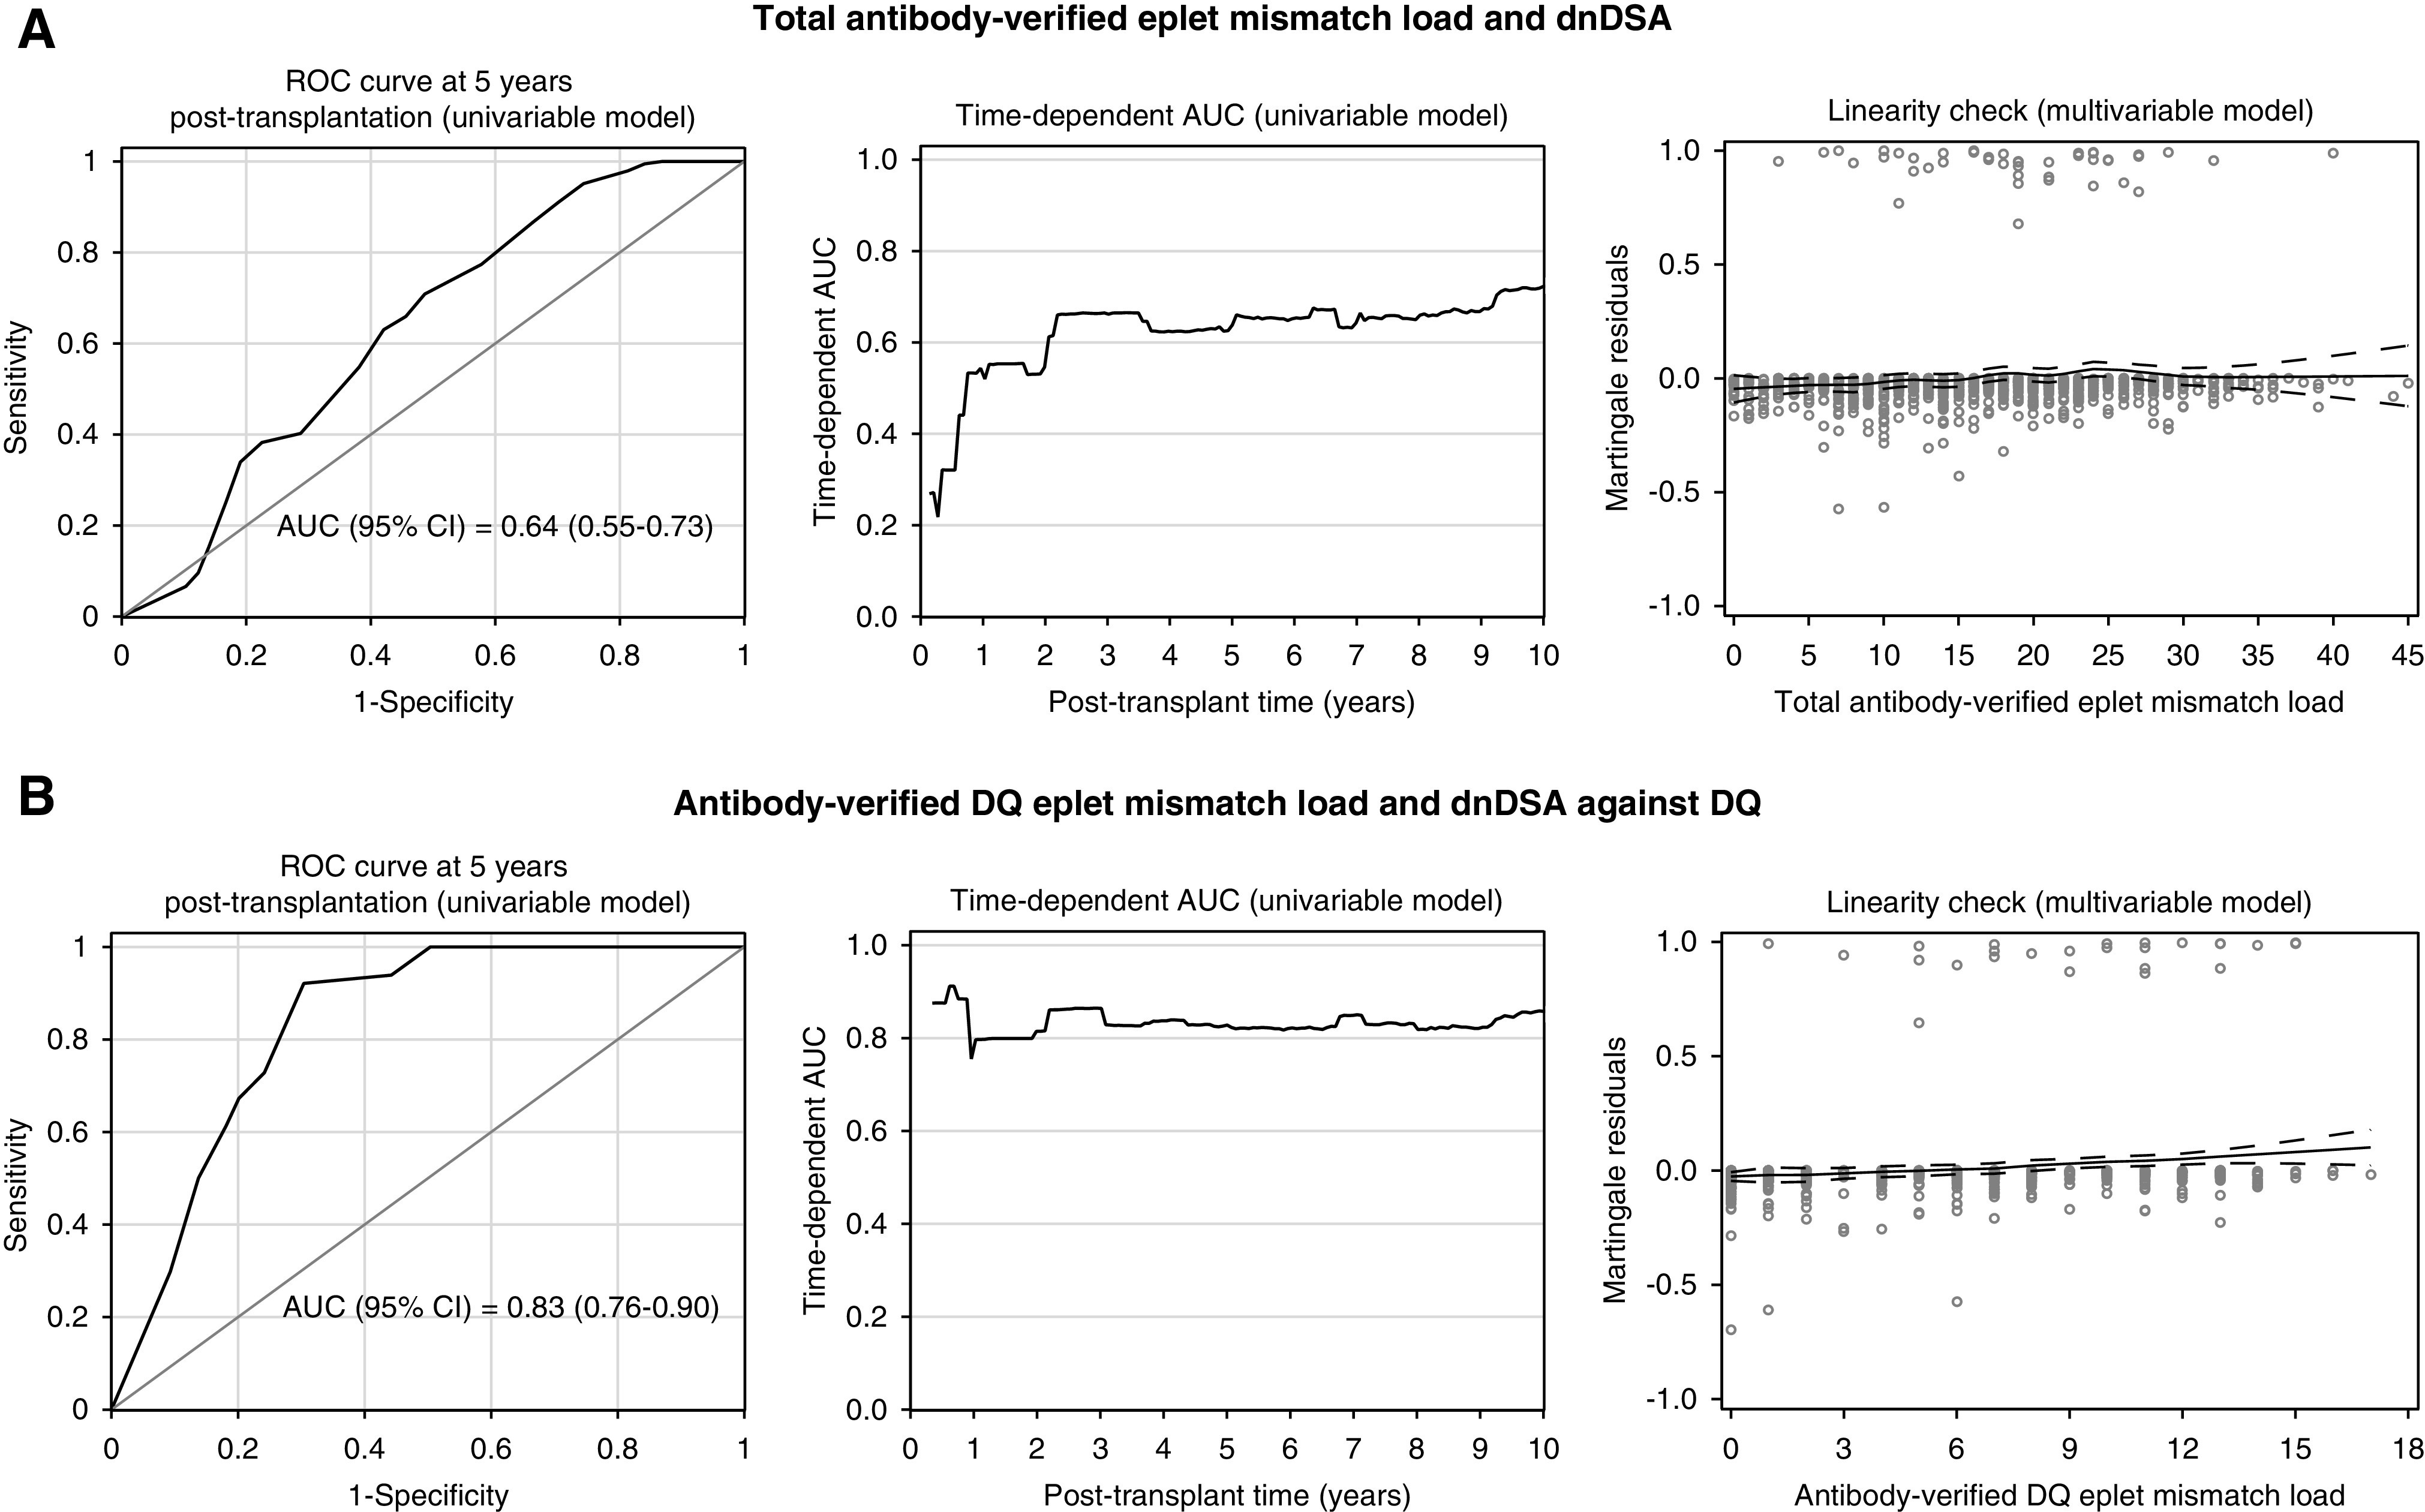
Figure 1.

Antibody-verified eplet mismatch load associated with the hazard rate of dnDSA formation, with a linear effect (dnDSA; n=926). The receiver operator characteristic (ROC) curve at 5 years after transplantation is depicted (left panel), together with the evolution of the time-dependent area under the curve (AUC) up to 10 years after transplantation (middle panel), and a linearity check of the association between eplet mismatch load and the risk of dnDSA occurrence (right panel). (A) The association between the total antibody-verified eplet mismatch load and overall dnDSA. (B) The association between the antibody-verified DQ eplet mismatch load and dnDSA against DQ. ROC curves and AUCs were based on the univariable Cox models; the Martingale residual plots were based on the multivariable Cox models. Because AUCs of the time-dependent ROC curves change at every event time, they differ from the overall C-statistics in Table 3. The latter could be interpreted as the “integrated AUC” over all event time points. In the Martingale residual plots, fitted Loess lines indicate which functional form is appropriate for modeling the covariates. There is no substantial deviation from a straight line in both plots, thereby showing no evidence for including the covariates other than linearly in the Cox model. Hence our data suggest no specific hazard threshold for total antibody-verified eplet mismatch load or for antibody-verified DQ eplet mismatch load.
