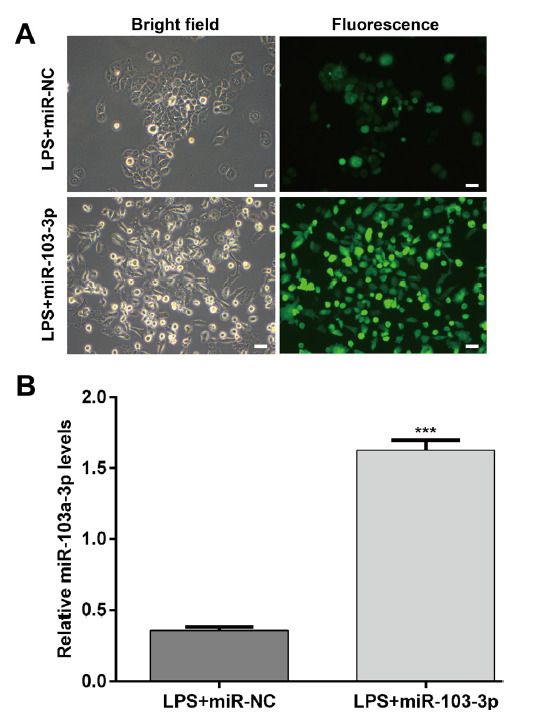
Fig 2.

MicroRNA-103a-3p oligonucleotide transfection and miR- 103a-3p expression in LPS-induced chondrocytes. (A) Representative fluorescence images captured using fluorescence microscopy. (B) MiR- 103a-3p expression levels in transfected chondrocytes. ***p < 0.001, as compared with LPS+miR-NC
