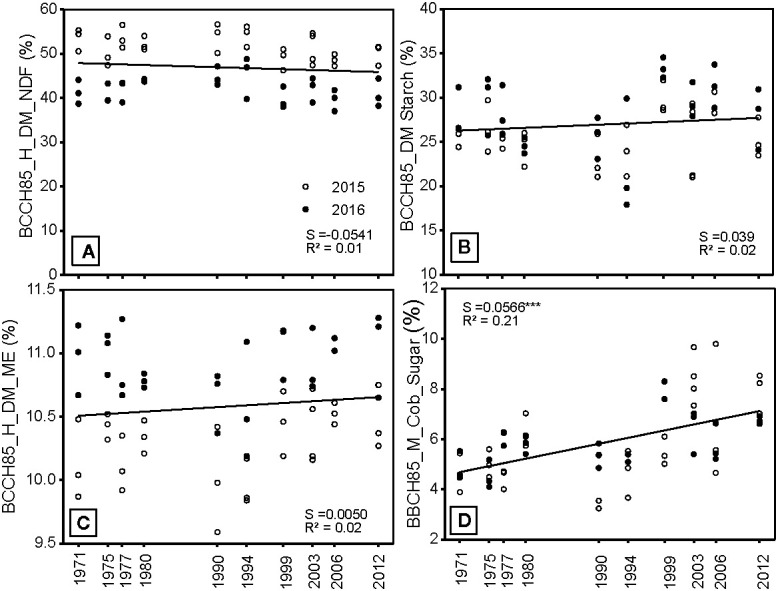
Figure 7.

(A) Neutral detergent (NDF) fiber concentration (B) starch concentration (C) metabolizable energy concentration and (D) cob sugar concentration of the silage forage measured in three blocks from 10 different hybrids, which were released in the period between 1971 and 2012 and either grown in 2015 or 2016. S = slope of the regression. The regression indicates differences among hybrids across the year of registration. All slopes were tested to be significantly different from zero. Significance levels are: ***p < 0.001.
