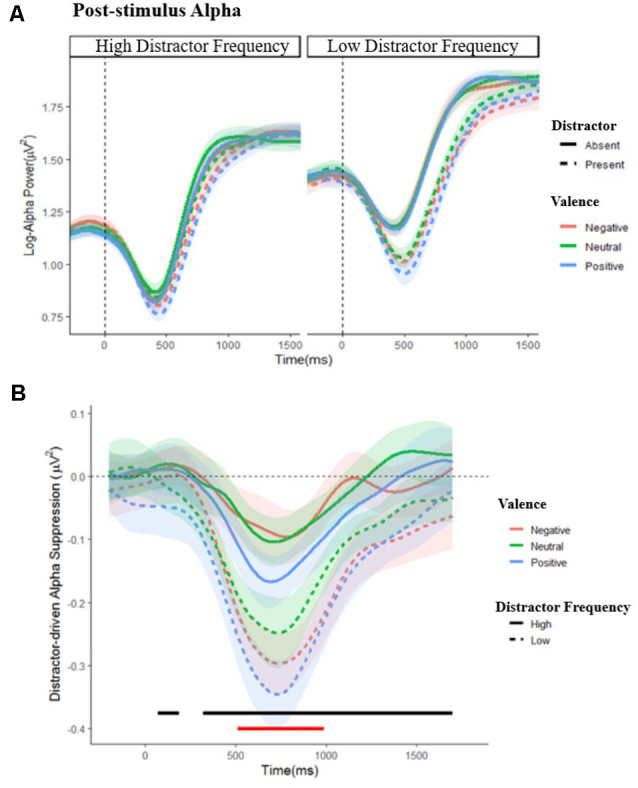
Figure 5.

Post-stimulus alpha power. (A) Grand average waveforms of post-stimulus alpha power in the low and high distractor frequency conditions, following either a distractor (dashed lines) or no-distractor (solid lines), appearing at 0 ms, by valence block. Stimulus onset occurs at 0 ms. (B) Distractor driven alpha suppression (calculated as Distractor Present − Distractor Absent alpha power) in the low (dashed lines) and high (solid lines) distractor frequency conditions. The black line indicates where distractor-driven alpha suppression was greater in the low compared to the high distractor frequency condition. The red line indicates where there was a main effect of valence: alpha was more suppressed following emotional compared to non-emotional distractors during this period. Shaded error bars depict the ±95% within-subjects confidence intervals.
