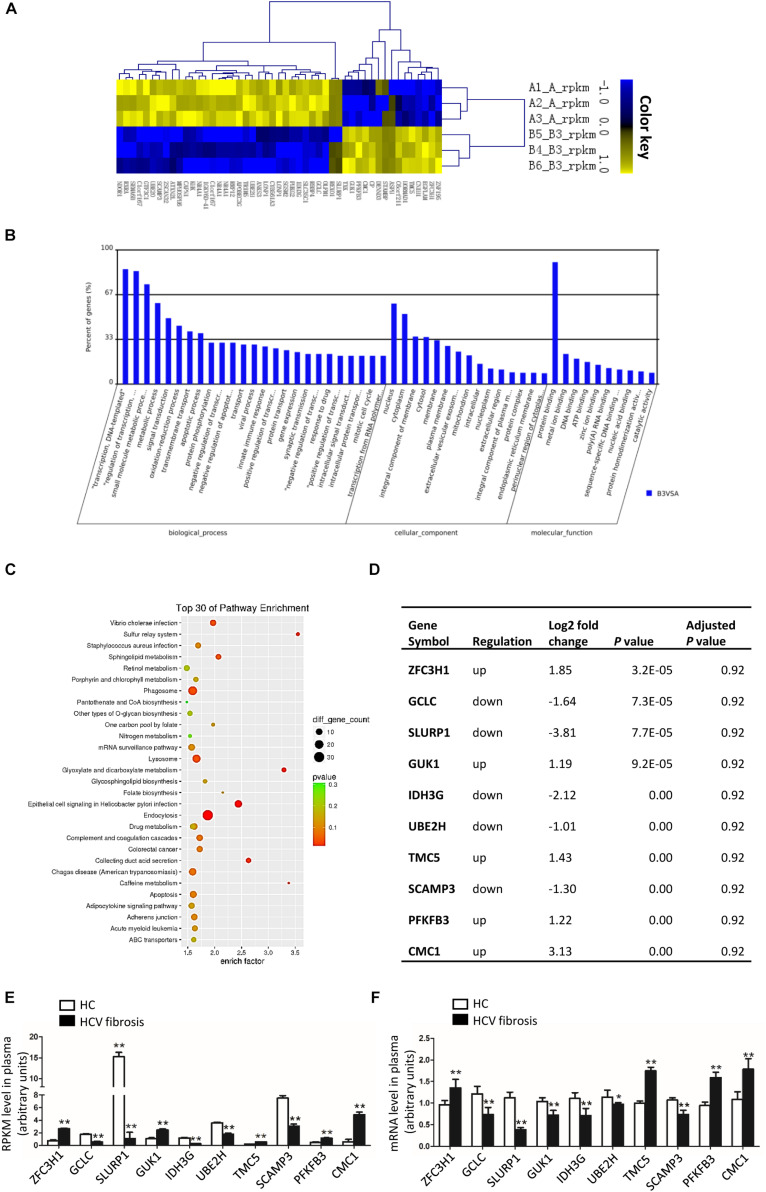
FIGURE 1.
Differentially expressed genes in patients with HCV-related liver fibrosis. (A–C) Heat map (A), GO analysis (B), and KEGG pathway analysis (C) of the differentially expressed genes of patients with HCV-related liver fibrosis. (D) List of top 10 differentially expressed genes in patients with HCV-related liver fibrosis according to the P-value of raw data. And the P-values were adjusted by Benjamini-Hochberg method to correct the false discovery rate. (E) RPKM level of top 10 genes in plasma. (F) mRNA levels of top 10 genes in plasma from Healthy control (n = 15) and HCV-related liver fibrosis patients (n = 20) were detected by qRT-PCR. *P < 0.05, **P < 0.01. HC, healthy control.

