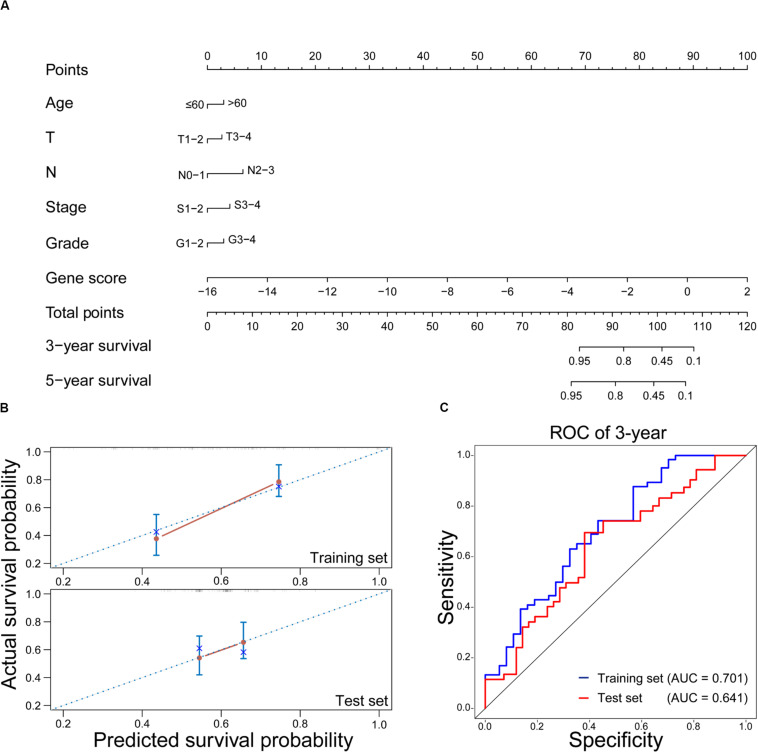
FIGURE 5.
Evaluation of the nomogram on predicting the OS of HNSCC patients with RT. (A) Nomogram for predicting the 3-year and 5-year OS in HNSCC with RT. (B) Calibration plots of the nomogram on the training and test sets. The 45-degree line represents the real outcomes. (C) Time-dependent ROC curves of 3-year OS prediction using the nomogram on the training and test sets.

