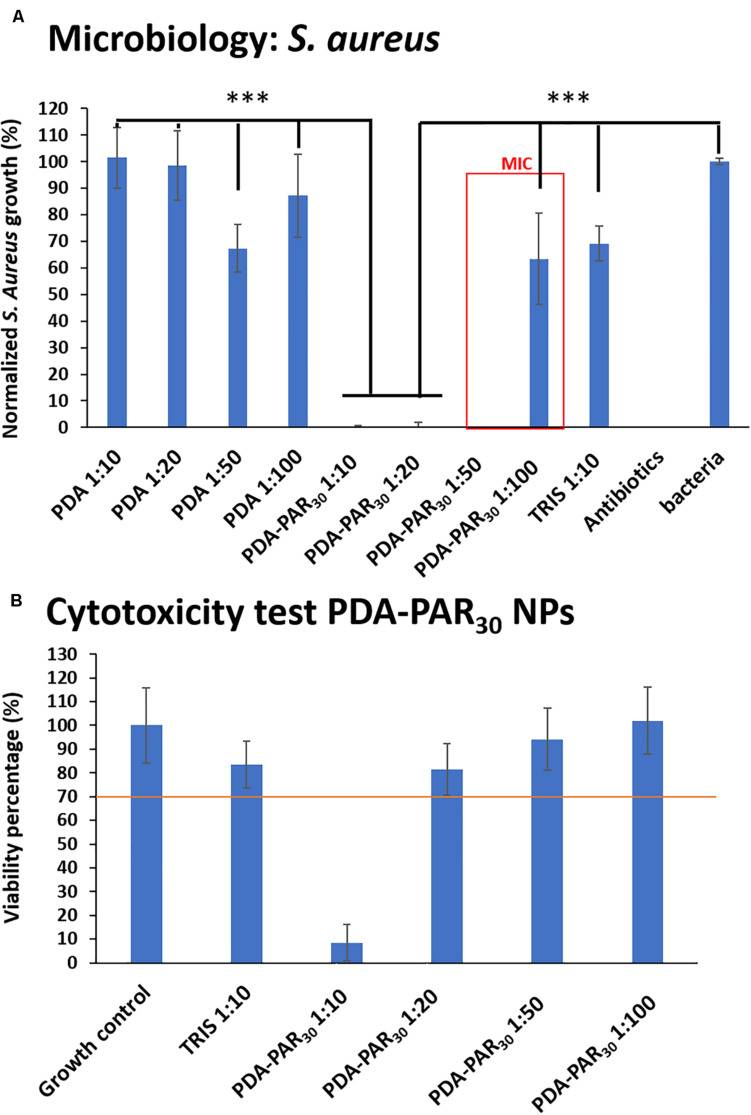
FIGURE 3.
(A) Normalized S. aureus growth in supernatant after 24 h in contact with different PDA-PAR30 0.2 NPs at different dilutions to determine the Minimum Inhibitory Concentration (MIC) (n = 3 and error bars correspond to standard deviations) (***p < 0.001). (B) Cytotoxicity test of the same NPs dilutions after 24 h of exposure with Balb 3T3 cells (n = 3 and error bars correspond to standard deviations).

