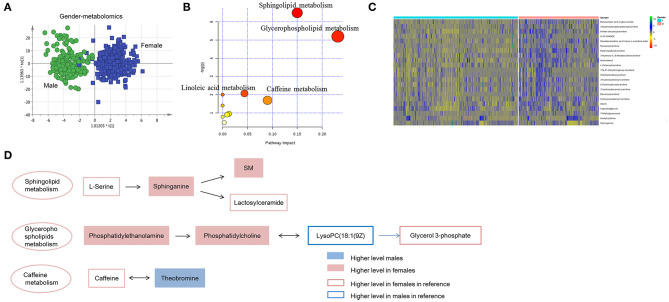
Figure 3.
Gender-dependent metabolomics/lipidomics characteristics. (A) Score plot of OPLS-DA model between females and males. Apparent separation of metabolomics was showed between males and females. (B) Pathway enrichment of gender-dependent metabolites and lipids. (C) Heat map showing the relative abundance of gender-dependent metabolites/lipids these performing important biological functions. (D) Highlighted pathways contain specific metabolites showing differences between the male and female. (A) Was created using simca 14.0; (B) Was created using MetaboAnalyst 3.0; (C) Was created using R package; (D) Was created using Microsoft office PPT 2007.

