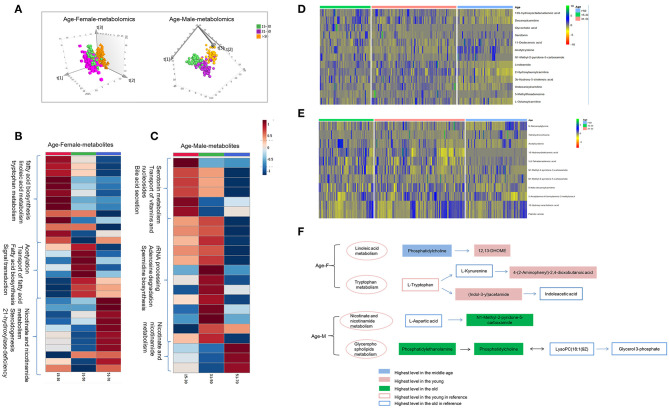
Figure 4.
Age-dependent metabolomics/lipidomics characteristics. (A) Score plot of PLS-DA model for three age groups based on plasma metabolomics in females and males. Metabolic profiling varied with age in both males and females. Differential metabolites and pathways with respect to aging in male (B) and female (C). Heat maps showing the relative abundance of age-dependent metabolites/lipids in male (D) and female (E) these performing important biological functions. (F) Highlighted pathways contain specific metabolites showing differences with age in male and female. (A) Was created using simca 14.0; (B,C) Were created using MetaboAnalyst 3.0; (D,E) Were created using R package; (F) Was created using Microsoft office PPT 2007.

