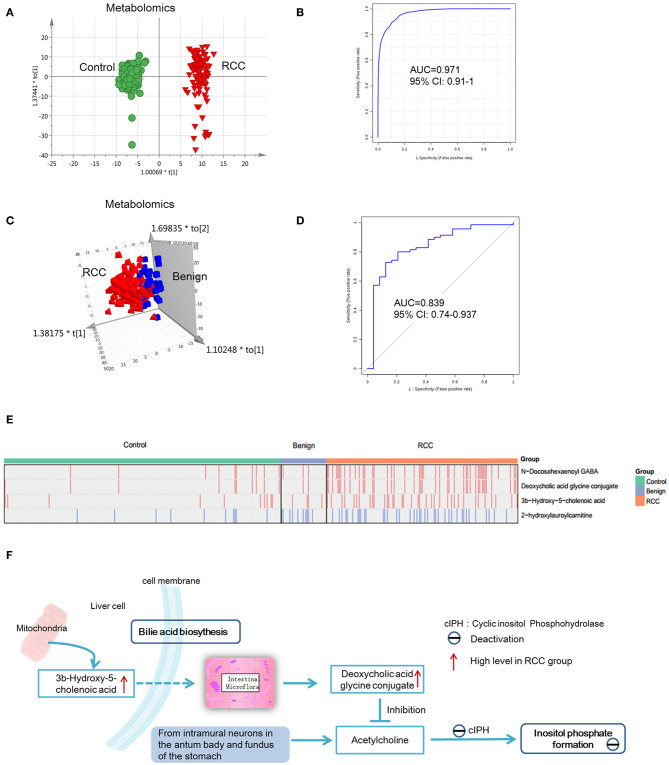
Figure 5.
Analysis of metabolite and lipid differences between RCC, control and benign tumors. (A) OPLS-DA-score plot of serum metabolomics between RCC and healthy control. The apparent separation indicated significant differences of metabolites between RCC and control groups. (B) ROC plot for RCC discrimination from control in validation group based on model established via differential metabolites and lipids through a panel consisting of diaminopimelic acid, 12,13-DHOME, 5-L-glutamyl-L-alanine, PC(38:4), 4,8-dimethylnonanoyl carnitine and cholesteryl 11-hydroperoxy-eicosatetraenoate. (C) OPLS-DA-score plot of serum metabolomics between RCC and benign tumors. Significant differences of metabolites and lipids between RCC and benign groups were existed. (D) ROC plot for RCC discrimination from benign tumors with 10-fold cross-validation based on the model established via differential metabolites and lipids, L-glutamine, PS(36:0), PG(40:9), N-docosahexaenoyl GABA and deoxycholic acid glycine conjugate. (E) Relative intensity of the common four metabolites/lipids in RCC and non-RCC groups. Take the four metabolites/lipids with a concentration above the 90% quantile of normal range in healthy population as positively upregulated/downregulated, they all showed higher prevalence in renal cancer patients than healthy controls and benign patients. Red: increased; blue, decreased. (F) Interaction of differential metabolites of RCC and the possible regulation mechanism in RCC. Dotted arrow, indirect action; solid arrow, direct action. (A,C) Were created using simca 14.0; (B,D) Were created using MetaboAnalyst 3.0; (E) Was created using R package; (F) Was created using Microsoft office PPT 2007.

