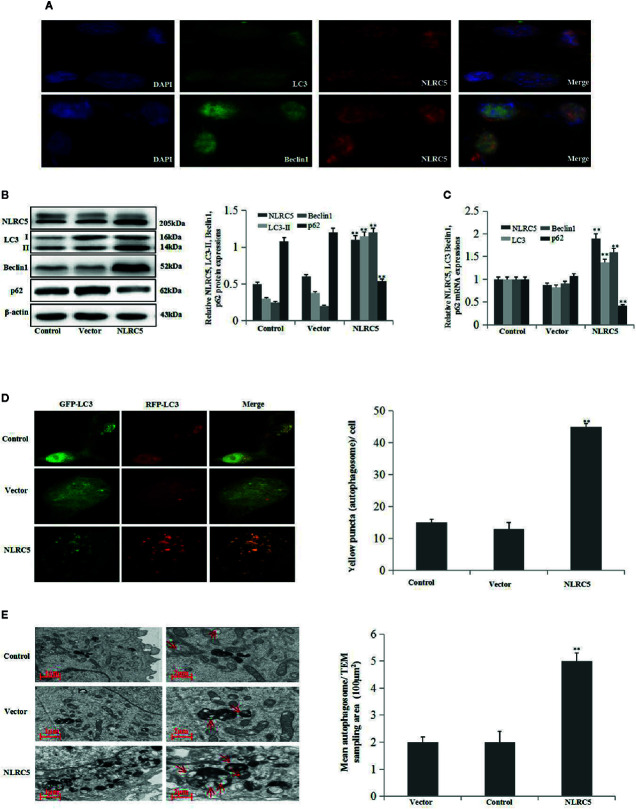
Figure 2.
Effect of NLRC5 over-expression on autophagy in EESCs (n = 7). (A) Representative image of immunofluorescence staining showing NLRC5 and LC3, Beclin1 are present both in the cytoplasm and nucleus, NLRC5 and LC3, Beclin1 were co-located in the nucleus. Photographs were taken at magnifications of 1600×. (B, C) Representative western blotting and qRT-PCR results showing over-expression of NLRC5 by transfection with NLRC5 plasmid significantly promoted NLRC5, LC3 Beclin1 expressions, and inhibited p62 expression when compared with vector group (**P < 0.01 vs. vector group). (D) Representative images showing LC3 staining in EESCs infected with GFP-RFP-LC3 adenovirus, over-expression of NLRC5 by transfection with NLRC5 plasmid significantly promoted yellow puncta when compared with vector group. Photographs were taken at magnifications of 1,600×, quantification of mean yellow puncta of 10–15 cells per condition is shown (**P < 0.01 vs. vector group). (E) Representative transmission electron microscopy (TEM) showing over-expression of NLRC5 by transfection with NLRC5 plasmid significantly promoted autophagosomes formation when compared with vector group, autophagosomes were highlighted by red arrows (left scale bar: 1μm; right scale bar: 2μm; **P < 0.01 vs. vector group). The expression levels of mRNA were normalized with respect to β-actin and were calculated using the 2-ΔΔCt method. The protein expression levels were quantified by Image J software and normalized to β-actin protein levels. The results are represented as the mean ± SEM from at least three independent experiments.

