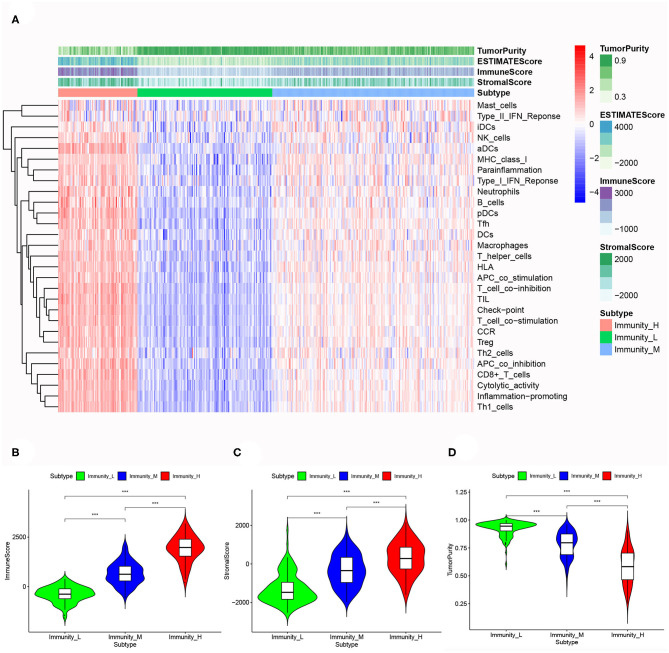
Figure 3.
(A) The correlation between immunogenomic classification and the level of tumor immune infiltration was showed based immune score, stromal score, tumor purity score. The three types of scores were calculated by the ESTIMATE algorithm. The violin plots specifically showed the differences in the three subtypes in terms of immune cell infiltration level (B), stromal cell content (C), and tumor purity (D). *p < 0.05, **p < 0.01, ***p < 0.001.

