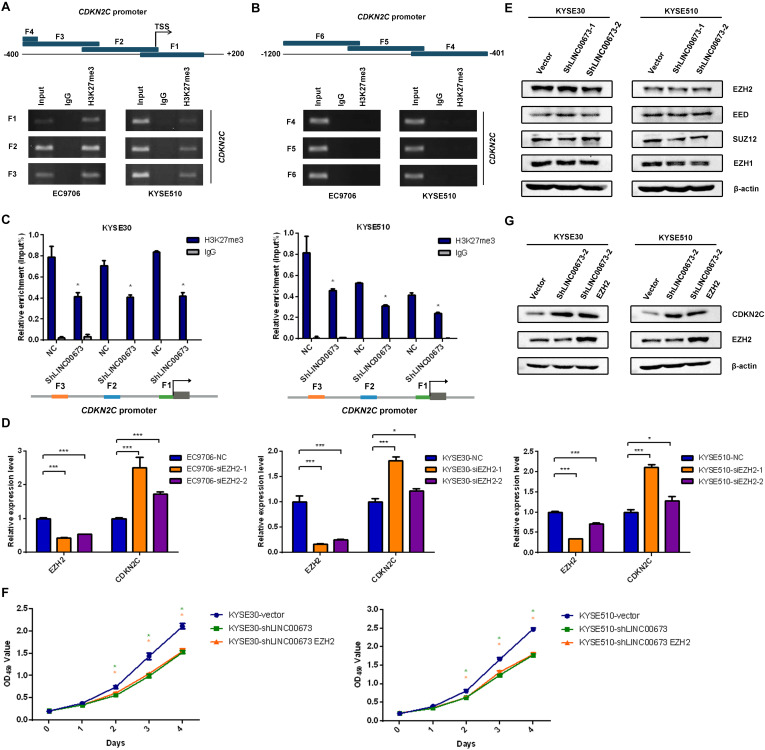
FIGURE 6.
H3K27me3 was enriched at the promoter region of CDKN2C. (A,B) Diagram of the promoter of the CDKN2C gene, with the transcription start site (TSS) indicated. The blue block represents the location of the F1–F6 fragments detected by chromatin immunoprecipitation (ChIP). ChIP assays were performed using an H3K27me3-specific antibody, followed by PCR amplification of six individual fragments representing CDKN2C promoter regions (F1–F6). Input and products immunoprecipitated by IgG were used as positive and negative controls, respectively. (C) ChIP assays were performed using an H3K27me3-specific antibody in KYSE30-shLINC00673, KYSE510-shLINC00673, and corresponding control cells, followed by quantitative PCR (qPCR) amplification of three individual fragments near the CDKN2C promoter (F1–F3). *P < 0.05 (unpaired Student’s t test). (D) CDKN2C expression levels were detected using qPCR after silencing EZH2 in EC9706, KYSE30, and KYSE510 cells. *P < 0.05, ***P < 0.001. (E) The major subunits of the PRC2 complex expression levels were detected by Western blotting analysis in stable KYSE30-shLINC00673, KYSE510-shLINC00673, and corresponding control cells. (F) Cell proliferation was assessed by the CCK8 method in KYSE30-shLINC00673 and KYSE510-shLINC00673 cells after transfection with EZH2. Bars show the mean ± SD of OD450 from triplicate samples. (G) EZH2 and CDKN2C expression levels were detected by Western blotting analysis after the transfection of EZH2 in KYSE30-shLINC00673 and KYSE510-shLINC00673 cells.

