Figure 1.
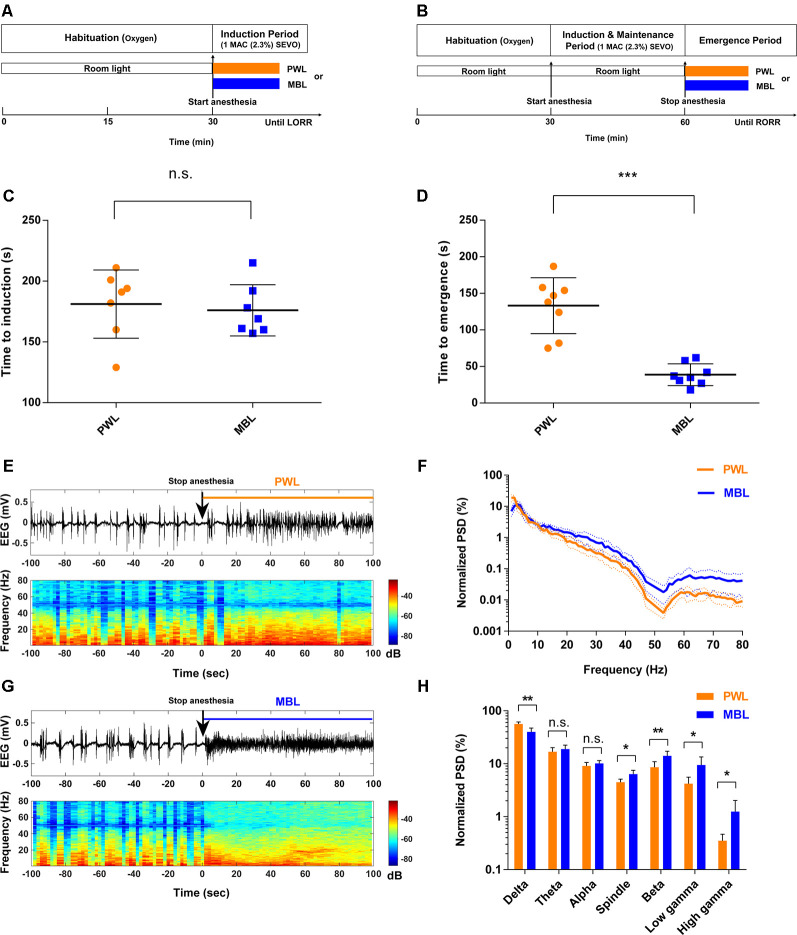
Monochromatic blue light (MBL) accelerated emergence from sevoflurane general anesthesia. (A,B) Timeline for light conditions administered during the induction (A) and recovery (B) periods with sevoflurane general anesthesia. (C,D) Induction (C) and emergence (D) times of anesthesia-induced by 1 minimum alveolar concentration (MAC; 2.3%) sevoflurane in the polychromatic white light (PWL) and MBL groups. MBL decreased the time to emergence (PWL, 133.10 ± 38.26 s, vs. MBL, 38.75 ± 14.96 s; ***p < 0.001 compared with PWL, n = 8 in each group, unpaired Student’s t-tests with Welch’s correction), while did not affect on the induction time (PWL, 181.10 ± 28.03 s vs. MBL, 176.00 ± 21.10 s) compared to PWL (n.s. = not significant compared with PWL, n = 7 in each group, unpaired Student’s t-tests with Welch’s correction). Data are expressed as mean ± SD. (E,F) Representative electroencephalogram traces (upper) and electroencephalogram power spectrogram (lower) in a mouse administered PWL (E) or MBL (F). Time 0 indicates stopping sevoflurane anesthesia and the beginning of light stimulation. The orange and blue lines indicate the 100 s intervals used for power spectral density comparisons. (G) Normalized group power spectral densities (PSD) in the PWL (orange) and MBL (blue) groups. (H) MBL decreased the relative electroencephalogram delta power and increased the spindle, beta, low gamma, and high gamma power compared to PWL (*p < 0.05, **p < 0.01 compared with PWL, n.s. = not significant, n = 6 in each group, unpaired Student’s t-tests with Welch’s correction). Data are expressed as mean ± SD. PWL, polychromatic white light; MBL, monochromatic blue light.

