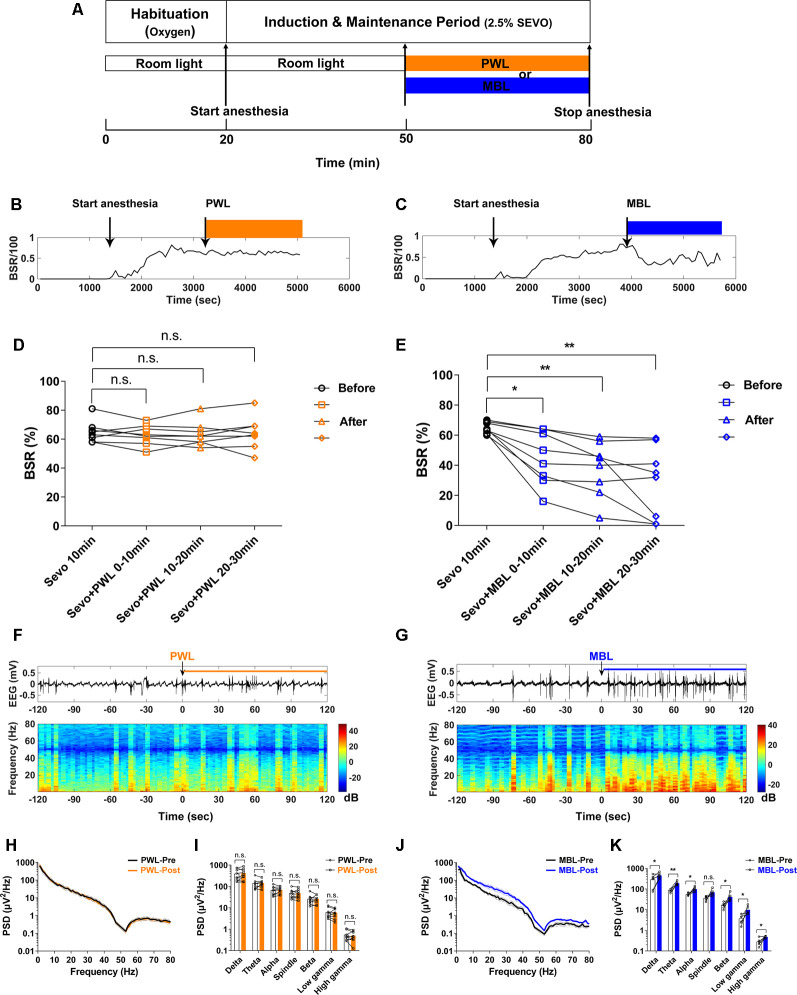
Figure 2.
MBL decreased the burst suppression ratio (BSR) during continuous inhalation of 2.5% sevoflurane. (A) Timeline for light conditions administered in the burst suppression period during continuous inhalation of 2.5% sevoflurane. (B,C) Typical examples of the BSR response under sevoflurane anesthesia in a mouse administered PWL (B) or MBL (C). The orange and blue boxes indicate the duration of light exposure. (D,E) Effect of PWL (D) and MBL (E) on electroencephalogram BSR during continuous inhalation of 2.5% sevoflurane. Mice treated with MBL showed a significant 31% decrease (*) in the BSR during the first 10 min post-MBL, a 42% decrease (**) during the second 10 min post-MBL, and a 55% decrease (**) during the last 10 min post-MBL compared to the pre-MBL 10 min (*p < 0.05, **p < 0.01 compared with pre-MBL 10 min, n = 8, RM one-way ANOVA, and Tukey’s multiple comparisons test with the Greenhouse-Geisser correction, F(2.007,14.05) = 16.18). However, PWL-treated animals showed no significant difference in the BSR compared to pre-PWL (n.s. = not significant, compared with pre-PWL 10 min, n = 8, RM one-way ANOVA, and Tukey’s multiple comparisons test with the Greenhouse-Geisser correction, F(2.540,17.78) = 0.5143). (F,G) Representative electroencephalogram traces (upper) and electroencephalogram power spectrogram (lower) in a mouse administered PWL (F) or MBL (G). Time 0 indicates the beginning of light stimulation during continuous sevoflurane anesthesia. The orange and blue lines indicate the 120 s intervals used for power spectral density comparisons. (H) Grouped PSD computed from 2 min before PWL (black) and 2 min after PWL (orange). (I) PWL-treated animals showed no statistically significant difference in electroencephalogram power compared to pre-PWL (n.s. = not significant, compared with pre-PWL, n = 9, and paired Student’s t-tests). (J) Grouped PSD computed from 2 min before MBL (black) and 2 min after MBL (blue). (K) MBL-treated animals increased electroencephalogram power in all of the frequency bands except for the spindle band compared to pre-MBL (*p < 0.05, **p < 0.01 compared with pre-MBL, n.s. = not significant, n = 6, and paired Student’s t-tests). PWL, polychromatic white light; MBL, monochromatic blue light.

