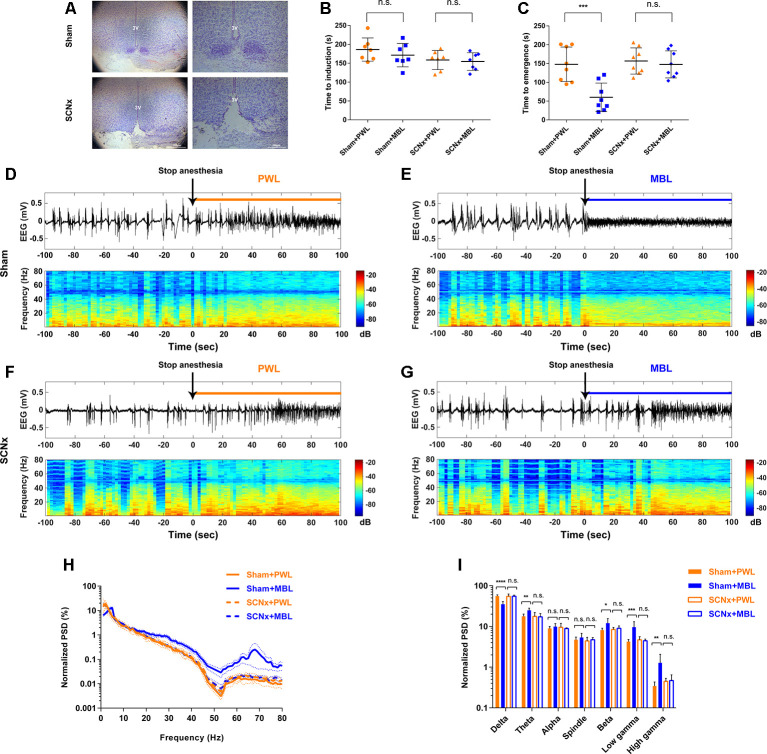
Figure 4.
Lesion of SCN neurons abolished MBL-induced arousal-promoting responses during sevoflurane anesthesia. (A) Nissl-stained coronal brain sections of the SCN are shown for the sham (upper) and SCN lesioned (lower) animals. 3V, third ventricle. Scale bar = 200 μm. (B) Results of the sevoflurane-inducing LORR time in the sham and SCNx groups (SCN lesioned), both of which received PWL or MBL, respectively. The sham animals treated with MBL showed no statistically significant difference in induction time relative to the sham-PWL mice (PWL, 186.10 ± 30.67 s vs. MBL, 171.30 ± 31.01 s) in sevoflurane anesthesia. The SCNx animals treated with MBL did not show a significant difference in induction times relative to those treated with PWL (158.40 ± 25.41 s vs. MBL, 154.60 ± 23.23 s) (n.s. = not significant, n = 7 in each group, F(3,24) = 1.848, ordinary one-way ANOVA, and Tukey’s multiple comparisons test). (C) The sham animals treated with MBL showed a significant decrease in recovery time relative to the sham-PWL mice (PWL, 147.90 ± 46.01 s vs. MBL, 60.13 ± 37.84 s) in sevoflurane anesthesia. The SCNx animals treated with MBL did not show a significant difference in recovery times relative to those treated with PWL (PWL, 156.80 ± 34.85 s vs. MBL, 147.60 ± 35.96 s; ***p < 0.001 compared with sham PWL, n.s. = not significant, n = 8 in each group, F(3,28) = 10.94, ordinary one-way ANOVA, and Tukey’s multiple comparisons test). Data are expressed as mean ± SD. (D–G) Representative electroencephalogram traces (upper) and electroencephalogram power spectrogram (lower) in the sham (D,E) and SCNx groups (SCN lesioned; F,G), both of which received PWL or MBL, respectively. Time 0 indicates stopping sevoflurane anesthesia and the beginning of light stimulation. The orange and blue lines indicate the 100 s intervals used for power spectral density comparisons. (H) Normalized group PSD from the sham PWL (orange solid line), sham MBL (blue solid line), SCNx PWL (orange dotted line), and SCNx MBL (blue dotted line) groups. (I) The sham animals treated with MBL showed a significant decrease in the relative electroencephalogram delta power and an increase in the theta, beta, low gamma, and high gamma power compared to the sham-PWL mice. The SCNx animals treated with MBL showed no significant difference in electroencephalogram power relative to those treated with PWL (*p < 0.05, **p < 0.01, ***p < 0.001, and ****p < 0.0001 compared with sham PWL, n.s. = not significant, n = 6 in each group, ordinary one-way ANOVA, and Tukey’s multiple comparisons test). Data are expressed as mean ± SD. PWL, polychromatic white light; MBL, monochromatic blue light.

