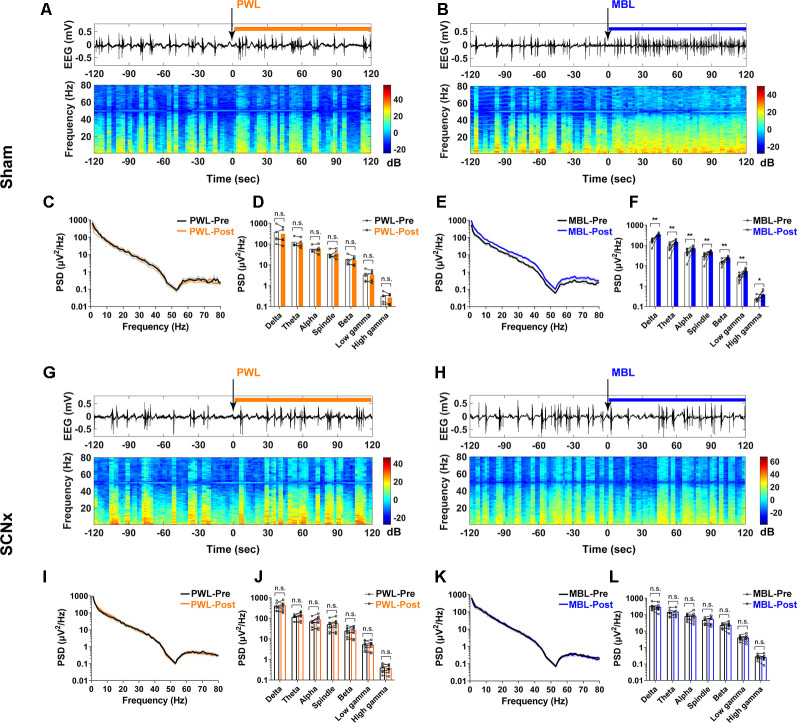
Figure 6.
Lesion of SCN neurons eliminated the increase in cortical EEG activity induced by MBL during continuous inhalation of 2.5% sevoflurane. (A,B) Representative electroencephalogram traces (upper) and electroencephalogram power spectrogram (lower) in the sham group-administered PWL (A) or MBL (B). Time 0 indicates the beginning of light stimulation during continuous sevoflurane anesthesia. The orange and blue lines indicate the 120 s intervals used for power spectral density comparisons. (C) PSD in the sham mice computed from 2 min before PWL (black) and 2 min after PWL (orange). (D) The sham mice treated with PWL showed no statistically significant difference in electroencephalogram power compared to sham pre-PWL (n.s. = not significant compared with sham pre-PWL, n = 5, paired Student’s t-tests). (E) PSD in the sham mice computed from 2 min before MBL (black) and 2 min after MBL (blue). (F) The sham mice treated with MBL showed increased electroencephalogram power in all of the frequency bands compared to sham pre-MBL (*p < 0.05 and **p < 0.01 compared with sham pre-MBL, n = 8, and paired Student’s t-tests). (G,H) Representative electroencephalogram traces (upper) and electroencephalogram power spectrogram (lower) in the SCNx group-administered PWL (G) or MBL (H). Time 0 indicates the beginning of light stimulation during continuous sevoflurane anesthesia. The orange and blue lines indicate the 120 s intervals used for power spectral density comparisons. (I) PSD in the SCNx mice computed from 2 min before PWL (black) and 2 min after PWL (orange). (J) The SCNx mice treated with PWL showed no statistically significant difference in electroencephalogram power compared to SCNx pre-PWL (n.s. = not significant compared with SCNx pre-PWL, n = 8, and paired Student’s t-tests). (K) PSD in the SCNx mice computed from 2 min before MBL (black) and 2 min after MBL (blue). (L) The SCNx mice treated with MBL showed no statistically significant difference in electroencephalogram power compared to SCNx pre-MBL (n.s. = not significant, compared with SCNx pre-MBL, n = 8, and paired Student’s t-tests). PWL, polychromatic white light; MBL, monochromatic blue light.

