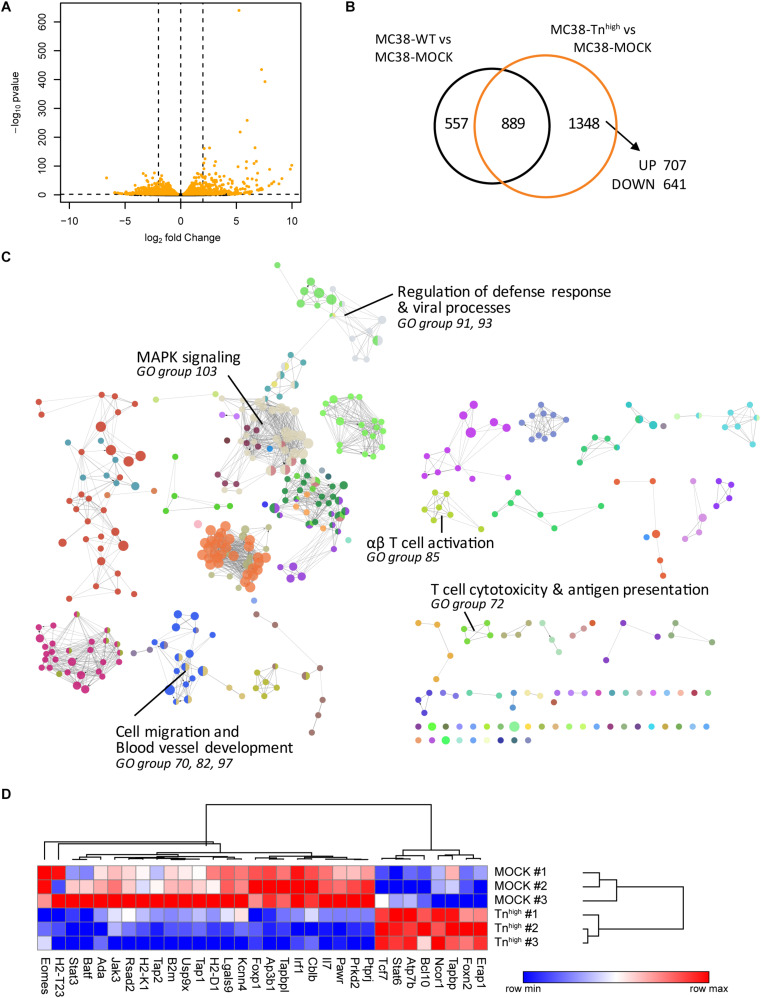
FIGURE 2.
Knockout of C1galt1c1 in tumor cells is associated with a decrease in antigen presentation and cytotoxic T cell activation. (A) Gene expression analysis in MC38-Tnhigh cells compared to MC38-MOCK cells. Depicted are the log2 fold change and FDR-adjusted p-values in a minus log 10 transformation. Differentially expressed genes (DEGs) (FDR < 0.05) are highlighted in orange. (B) Comparative analysis of DEGs in MC38-WT vs MC38-MOCK cells and MC38-Tnhigh vs MC38-MOCK cells. (C) Significant enriched GO terms annotated to the 1348 DEGs in MC38-COSMC KO cells. (D) Expression profile (log2 normalized counts) of the genes involved in antigen presentation and T cell activation.

