Figure 3.
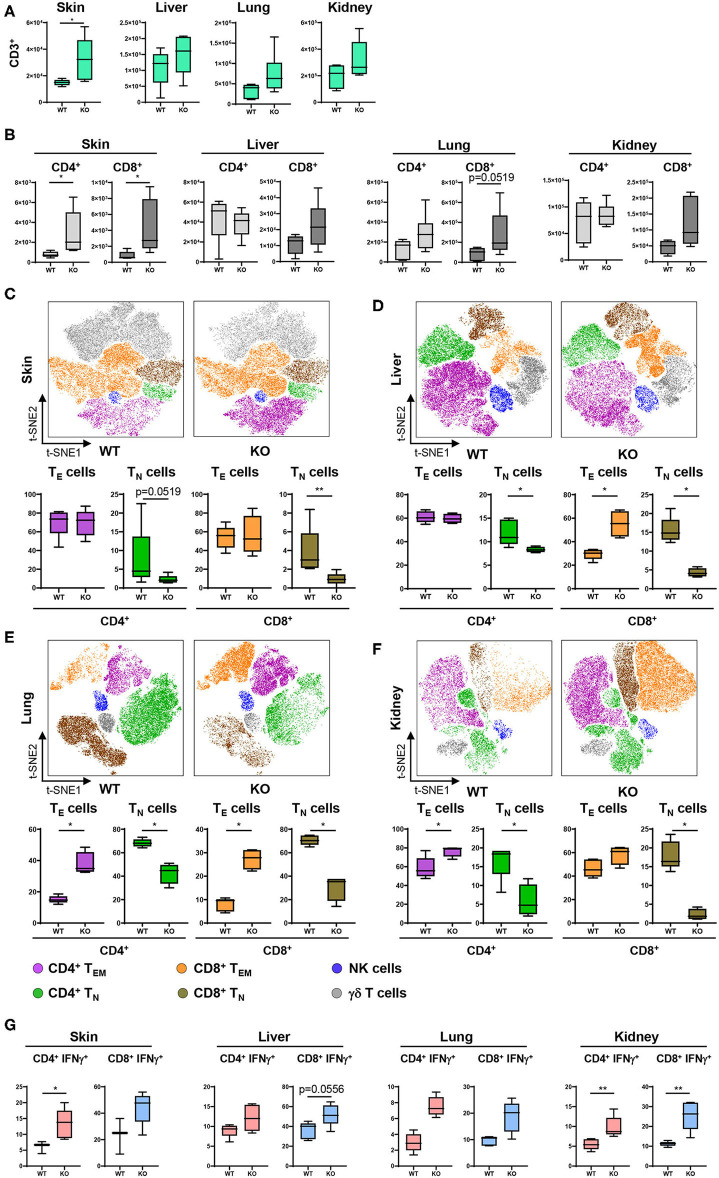
PTPN2 in DCs affects T cell infiltration and activation. (A) Absolute numbers of CD3+ T cells in PTPN2fl/fl (WT) and PTPN2fl/fl × CD11cCre (KO) mice. (B) Absolute numbers of CD4+ and CD8+ T cells. (C–F) tSNE map of CD3+ cells from 5-weeks-old mice in skin (C), liver (D), lung (E), and kidney (F). Colors correspond to FlowSOM-guided clustering of cell populations. (C–F) Relative frequencies of T cell subsets in skin (C), liver (D), lung (E), and kidney (F). (G) Manually gated IFNγ expression of CD4+ and CD8+ T cells. Data are representative of two independent experiments with n ≥ 4 mice (A–F). *p < 0.05; **p < 0.01 [two-tailed Mann Whitney test (A–F)]. Data are shown as mean ± s.d. (A–F).

